Context
Understanding where and how bias enters AI systems is crucial for effective fairness assessment and intervention. While Part 1 established the historical patterns of discrimination that persist in technology and Part 2 provided precise fairness definitions, Part 3 examines the specific mechanisms through which bias manifests throughout the machine learning lifecycle.
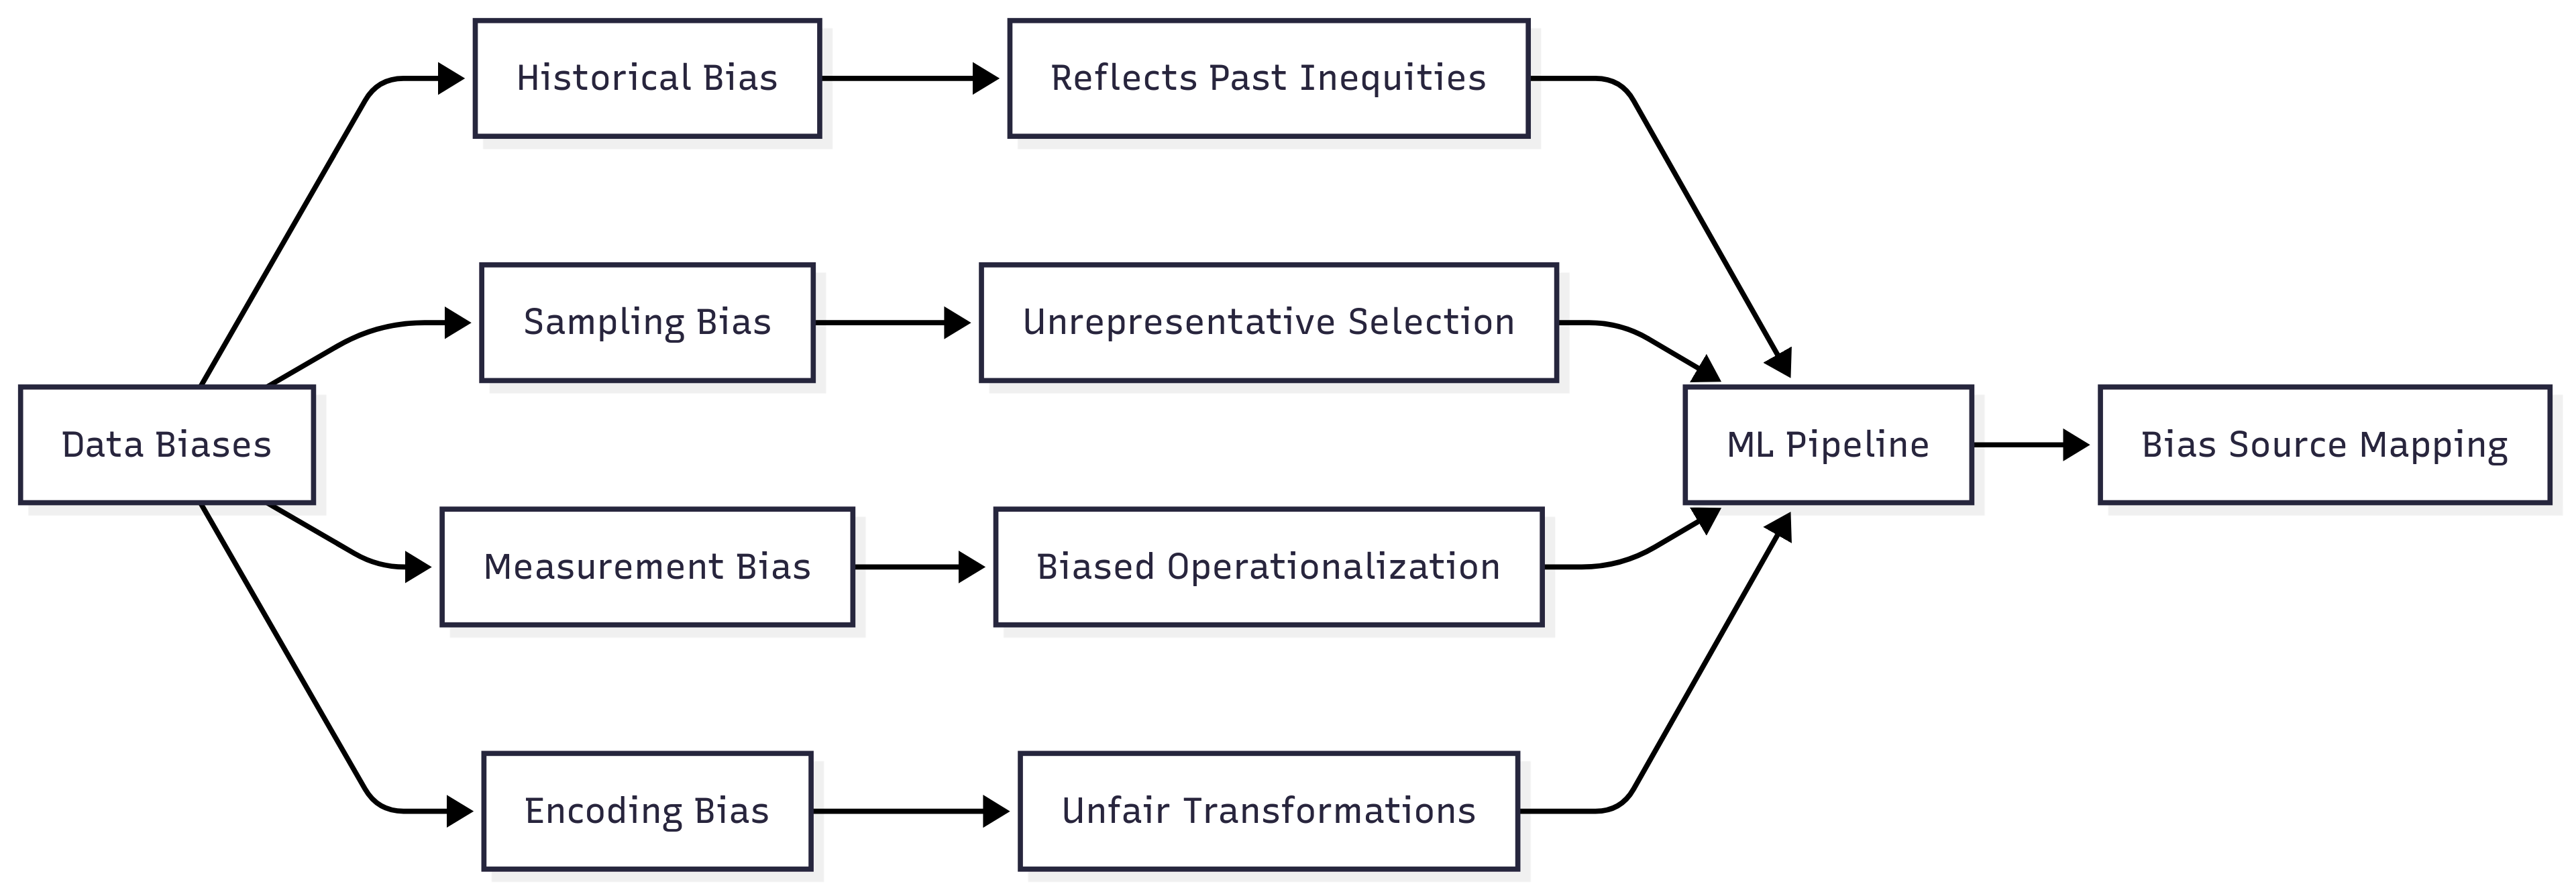
Bias in AI systems emerges through multiple pathways. These include historical bias (reflecting existing inequities), representation bias (uneven sampling across groups), measurement bias (flawed operationalization of concepts), and deployment bias (misalignment between development and application contexts). These categories help practitioners move beyond treating bias as a monolithic issue to identifying specific mechanisms requiring targeted interventions.
Data serves as the foundation for ML systems, making data-level biases particularly influential. Sampling procedures that underrepresent marginalized groups, measurement approaches that embed problematic assumptions, and feature engineering decisions that prioritize certain characteristics all introduce bias before model training begins.
Beyond data issues, bias emerges through algorithmic design choices and system dynamics. Optimization objectives that prioritize overall accuracy often underserve minority groups, while feedback loops can amplify small initial disparities into significant fairness concerns over time, particularly in systems where predictions influence future data collection.
The Bias Source Identification Tool you'll develop in Unit 5 represents the third component of the Fairness Audit Playbook (Sprint Project). This tool will help you systematically identify potential bias sources at different stages of the ML lifecycle, ensuring that your fairness assessments and interventions address root causes rather than merely symptoms.

Learning Objectives
By the end of this Part, you will be able to:
- Classify different types of bias using taxonomic frameworks. You will apply systematic frameworks to categorize biases by type, source, and lifecycle stage, moving beyond vague assessments of "unfairness" to precisely identify specific bias mechanisms.
- Analyze how data collection and representation choices introduce bias. You will examine how sampling procedures, measurement approaches, and feature engineering decisions embed biases in training data, identifying potential fairness issues at the data foundation.
- Evaluate how algorithm design and implementation choices affect fairness. You will assess how model architecture, optimization objectives, and hyperparameter choices can amplify or mitigate biases, recognizing how technical decisions impact fairness outcomes.
- Identify feedback loops and system dynamics that amplify biases. You will analyze how system interactions and deployment contexts create self-reinforcing cycles that magnify biases over time, addressing dynamic fairness concerns rather than viewing bias as static.
- Develop systematic methodologies for tracing unfairness to specific sources. You will create structured approaches for connecting observed fairness disparities to their underlying causes in complex systems, enabling targeted interventions that address fundamental issues rather than symptoms.
Units
Unit 1
Unit 1: Data Collection and Representation Biases
1. Conceptual Foundation and Relevance
Guiding Questions
- Question 1: How do sampling procedures, feature selection, and measurement choices in data collection embed or amplify existing biases in AI systems?
- Question 2: What systematic approaches can data scientists implement to identify, quantify, and mitigate representation biases before they become encoded in model parameters?
Conceptual Context
Understanding data collection and representation biases forms the critical first step in addressing fairness in AI systems. These biases represent the foundation upon which all subsequent modeling decisions rest. If biased data enters your pipeline, even the most sophisticated fairness interventions at later stages may prove insufficient to create truly fair outcomes.
Data collection and representation biases are particularly insidious because they often appear as technical or methodological decisions rather than explicit fairness concerns. Choices about which features to measure, how to operationalize concepts, where to gather samples, and how to encode categorical variables can embed historical patterns of discrimination into seemingly objective datasets. As Obermeyer, Powers, Vogeli, and Mullainathan (2019) demonstrated in their analysis of healthcare algorithms, even when protected attributes are excluded, the selection of proxy variables and measurement approaches can perpetuate significant biases that directly impact vulnerable populations (Obermeyer et al., 2019).
This Unit builds on the historical foundations established at the beginning of this Sprint and will serve as the basis for exploring algorithm design biases in Unit 2 and feedback loop amplification in Unit 3. The insights you develop here will directly inform the Bias Source Identification Tool we will develop in Unit 5, particularly in identifying data-level entry points where bias can infiltrate ML systems.
2. Key Concepts
Historical Bias in Data Collection
Historical bias occurs when data reflect existing prejudices, inequalities, or discriminatory practices in society—even when the data collection process itself appears statistically sound. This concept is crucial for AI fairness because machine learning systems trained on such data will inevitably learn and potentially amplify these historical patterns unless specific interventions are implemented.
Historical bias interacts with other forms of data bias by creating the underlying conditions in which they operate. For instance, sampling bias (discussed below) becomes particularly problematic when it intersects with historical bias, as the underrepresentation of certain groups compounds with historically biased measurements to create multiple layers of disadvantage.
Research by Buolamwini and Gebru (2018) provides a concrete application of this concept in facial recognition systems. They found that commercial facial analysis algorithms exhibited accuracy disparities of up to 34.4% between lighter-skinned males and darker-skinned females. These disparities stemmed directly from historical biases in benchmark datasets that severely underrepresented darker-skinned individuals, particularly women (Buolamwini & Gebru, 2018). The practical implication is that technologies deployed using such algorithms would systematically provide worse service to already marginalized groups.
For the Bias Source Identification Tool we will develop, understanding historical bias will be essential for distinguishing between bias patterns that emerge from data collection practices versus those introduced during model development. This distinction directs where in the ML pipeline interventions should be targeted and what forms they should take.
Sampling and Selection Bias
Sampling bias occurs when the process of data collection results in a dataset that does not accurately represent the population on which the model will ultimately be deployed. This concept is fundamental to AI fairness because models generalize based on the patterns present in their training data; if certain groups are underrepresented or overrepresented, the model will perform disproportionately well or poorly on those groups.
Sampling bias often interacts with measurement bias (discussed next) by influencing not just who appears in datasets but how their characteristics are measured, potentially creating compounding effects where marginalized groups are both underrepresented and less accurately characterized.
A powerful application example comes from Larson, Mattu, Kirchner, and Angwin’s (2016) investigation of COMPAS recidivism prediction algorithms, which demonstrated how sampling bias in criminal justice data led to significantly higher false positive rates for Black defendants compared to White defendants. The data reflected historical patterns of over-policing in certain communities, creating a feedback loop in which predictions based on biased samples reinforced discriminatory practices (Larson et al., 2016).
For our Bias Source Identification Tool, identifying sampling bias will require examining both the demographic distribution of datasets and the processes by which those datasets were constructed. This analysis will guide recommendations for data augmentation, reweighting, or the collection of additional samples to address representation disparities before model development begins.
Measurement Bias
Measurement bias emerges when the features selected, the variables operationalized, or the metrics chosen for a machine learning task systematically disadvantage certain groups. This concept is critical for AI fairness because seemingly technical choices about what to measure and how to measure it embed assumptions that can create or reinforce disparities.
Measurement bias connects deeply with both historical and sampling biases, as measurement choices often reflect historical practices and are constrained by available samples. The interplay between these biases creates complex patterns that require multifaceted analysis and intervention.
Research by Obermeyer et al. (2019) provides a striking example of measurement bias in healthcare. They discovered that an algorithm widely used to identify patients for additional care resources systematically discriminated against Black patients. The bias stemmed from using healthcare costs as a proxy for healthcare needs—a measurement choice that failed to account for historical inequities in healthcare access. Although Black patients had the same level of illness as White patients, they generated lower costs due to structural barriers to healthcare access, resulting in the algorithm systematically underrating their need for additional care (Obermeyer et al., 2019).
For the Bias Source Identification Tool component of our Sprint Project, understanding measurement bias will guide the development of systematic questionnaires and analysis approaches to examine how feature selection, variable operationalization, and metric definition might introduce fairness issues across different application domains. This will ensure the framework can identify bias sources across diverse data types and measurement approaches.
Feature Representation and Encoding Bias
Feature representation and encoding bias occurs when the way features are transformed, normalized, categorized, or encoded systematically disadvantages certain groups. This concept is essential for AI fairness because technical choices about data representation that appear neutral can actually embed or amplify biases when they interact with group differences in feature distributions or semantics.
This form of bias interacts with measurement bias but focuses specifically on how measurements are represented in the final dataset rather than on what is being measured. Both aspects require careful examination to identify potential fairness issues.
As an application example, consider research by Bolukbasi, Chang, Zou, Saligrama, and Kalai (2016) on bias in word embeddings, which demonstrated how standard encoding methods for text data captured and amplified gender stereotypes present in training corpora. These embeddings then propagated these biases to downstream applications that used them as feature representations. Their work showed that the analogy “man is to computer programmer as woman is to homemaker” emerged in standard word embeddings, demonstrating how encoding choices embedded historical gender disparities (Bolukbasi et al., 2016).
For our Bias Source Identification Tool, analyzing feature representation and encoding bias will require a systematic examination of data transformation pipelines, normalization procedures, and encoding schemes to identify potential disparate impacts across groups. This analysis will inform recommendations for alternative representation approaches that minimize bias while preserving necessary information content.
Domain Modeling Perspective
From a domain modeling perspective, data collection and representation biases map directly to specific components of ML systems:
- Data Collection Processes: Sampling procedures, inclusion/exclusion criteria, and data gathering methodologies all present entry points for bias.
- Feature Definition: Operationalizing real-world concepts into measurable features involves decisions that can embed unfair assumptions.
- Data Transformation Pipeline: Preprocessing steps—including normalization, binning, encoding, and imputation—can amplify or introduce biases.
- Dataset Documentation: Metadata about how data were collected and transformed provides crucial context for identifying potential bias sources.
These domain components form the earliest stages in the ML lifecycle where bias can enter, making them critical control points for fairness interventions. The Bias Source Identification Tool will need to provide systematic approaches for analyzing each of these components to identify specific mechanisms through which bias enters training data.
Intersectionality Consideration
Data collection and representation biases present unique challenges for intersectional fairness analysis, where multiple protected attributes interact to create distinct patterns of advantage or disadvantage. Datasets often have particularly poor representation at demographic intersections, creating amplified bias effects for individuals with multiple marginalized identities.
For example, as demonstrated by Buolamwini and Gebru (2018), facial recognition systems may show acceptable aggregate performance across gender (combining all races) and across race (combining all genders), while exhibiting significant accuracy disparities at specific intersections such as "dark-skinned women." These intersectional effects remain hidden unless explicitly analyzed (Buolamwini & Gebru, 2018).
In practical implementation, addressing intersectional considerations in data collection requires:
- Intentional sampling strategies that ensure adequate representation across demographic intersections, not just primary groups;
- Measurement approaches that are validated across intersectional subgroups to ensure consistent quality;
- Encoding methods that preserve intersectional information rather than flattening to single-attribute categories; and
- Analysis frameworks that explicitly examine bias patterns at demographic intersections rather than treating protected attributes independently.
The Bias Source Identification Tool must incorporate these intersectional considerations by developing analysis approaches that systematically examine how bias manifests across demographic intersections, even when sample sizes at those intersections are limited.
3. Practical Considerations
Implementation Framework
To systematically identify and address data collection and representation biases, implement the following structured methodology:
-
Dataset Demographic Audit:
-
Analyze the demographic distribution of your dataset across protected attributes and their intersections.
- Compare this distribution to relevant population benchmarks to identify representation disparities.
-
Calculate representation ratios and statistical significance of observed disparities.
-
Collection Process Analysis:
-
Document how samples were selected and what inclusion/exclusion criteria were applied.
- Identify potential selection mechanisms that might create systematic under- or overrepresentation.
-
Analyze geographic, temporal, and contextual factors that influenced data collection.
-
Feature Construction Examination:
-
For each feature, document how it was operationalized and measured.
- Analyze whether measurement approaches have been validated across demographic groups.
-
Identify potential proxies for protected attributes that might enable indirect discrimination.
-
Transformation Pipeline Audit:
-
Review normalization, encoding, and imputation procedures for potential disparate impacts.
- Test alternative encoding methods and evaluate differences in resulting distributions.
- Analyze how missing data patterns vary across groups and how imputation might affect fairness.
These methodologies integrate with standard ML workflows by extending data profiling and exploratory data analysis to explicitly incorporate fairness considerations. While they add additional analysis requirements, they leverage many existing data science practices while reorienting them toward fairness evaluation.
Implementation Challenges
When implementing these approaches, practitioners commonly encounter the following challenges:
-
Limited Demographic Information: Many datasets lack protected attribute information, making direct bias assessment difficult. Address this by:
-
Using validated proxy variables when appropriate (with careful documentation of limitations);
- Performing sensitivity analysis to estimate potential bias ranges under different assumptions; and
-
Collecting additional demographic data when possible, with appropriate privacy protections.
-
Stakeholder Alignment on Fairness Definitions: Different organizational stakeholders may have conflicting fairness priorities. Address this by:
-
Documenting explicit fairness definitions and metrics before beginning analysis;
- Creating visualizations that illustrate trade-offs between different fairness definitions; and
- Developing clear communication frameworks for explaining technical bias concepts to nontechnical stakeholders.
Successfully implementing data bias analysis requires computational resources for detailed distribution analysis, expertise in both statistical methods and domain knowledge of how bias manifests in specific contexts, and organizational commitment to addressing identified issues—even when they require additional data collection or preparation efforts.
Evaluation Approach
To assess whether your bias identification and mitigation approaches are effective, implement these evaluation strategies:
-
Comparative Distribution Analysis:
-
Calculate statistical distance metrics (e.g., Kullback–Leibler divergence, Earth Mover's distance) between distributions of features across demographic groups.
- Set acceptable thresholds based on domain-specific fairness requirements.
-
Document distribution changes after bias mitigation interventions.
-
Representation Metrics:
-
Calculate representation disparity metrics showing how sample proportions deviate from population benchmarks.
- Establish minimum representation thresholds for demographic intersections based on statistical power requirements.
-
Track improvements in representation through data augmentation or reweighting.
-
Measurement Validation:
-
Assess feature validity across demographic groups through correlation analysis with ground truth when available.
- Establish acceptable bounds for measurement differences between groups.
- Document measurement improvements through alternative operationalization approaches.
These metrics should be integrated with your organization's broader fairness assessment framework, providing inputs to subsequent bias identification components focusing on algorithmic design and feedback effects.
4. Case Study: Credit Scoring System
Scenario Context
A financial services company is developing a machine learning–based credit scoring system to predict default risk for loan applicants. The system will inform lending decisions, interest rates, and credit limits offered to customers. Key stakeholders include the lending institution concerned with risk management, regulators focused on fair lending practices, and diverse applicants seeking equitable access to financial services.
Fairness is particularly critical in this domain due to historical patterns of lending discrimination based on race, gender, and geographic location. Legal frameworks, including the Equal Credit Opportunity Act, specifically prohibit discrimination in lending, making fairness both an ethical and compliance requirement.
Problem Analysis
Applying core concepts from this Unit reveals several potential data biases in the credit scoring scenario:
- Historical Bias: The company plans to use its historical lending data for training. Analysis reveals that these data reflect past discriminatory lending practices in which certain neighborhoods (predominantly minority-populated) received fewer loans despite similar creditworthiness to applicants in other areas. This historical pattern created a "financial redlining" effect that would be perpetuated in the new model if not addressed.
- Sampling Bias: The historical dataset predominantly contains applicants who received loans, creating selection bias because rejected applicants are not well represented. Further examination shows that the data underrepresent younger applicants, recent immigrants, and individuals from rural areas—groups with less established credit histories but not necessarily higher default risks.
- Measurement Bias: The operationalization of "creditworthiness" relies heavily on traditional credit history length and conventional financial products, such as credit cards and mortgages. This measurement approach disadvantages groups that use alternative financial services or have limited credit histories despite responsible financial behavior (e.g., consistently paying rent and utilities on time).
- Encoding Bias: Categorical variables—including occupation and education—are encoded using schemes that implicitly rank certain professions and educational paths higher than others in ways that correlate with protected attributes. In addition, zip codes are encoded as categorical variables with unique embeddings, potentially encoding neighborhood demographics into the feature representation.
From an intersectional perspective, the data show particularly sparse representation at the intersection of young age (under 30), female gender, and minority racial status, creating a high risk of poor model performance for these intersectional groups.
Solution Implementation
To address these identified data biases, the team implemented a structured approach:
-
For Historical Bias, they:
-
Collaborated with domain experts to identify historically discriminatory patterns in lending data;
- Augmented their training data with additional sources, including data from community development financial institutions serving underrepresented communities; and
-
Created synthetic data using fairness-aware generation techniques to fill representational gaps.
-
For Sampling Bias, they:
-
Implemented a stratified sampling approach ensuring adequate representation across demographic groups and intersections;
- Applied appropriate reweighting techniques to adjust for representation disparities; and
-
Used reject inference techniques to model outcomes for historically rejected applicants.
-
For Measurement Bias, they:
-
Expanded their feature set to include alternative financial data, such as rental and utility payment history;
- Validated all features for predictive accuracy across demographic groups, removing features that showed divergent validity; and
-
Developed composite features that captured financial responsibility through multiple complementary measures.
-
For Encoding Bias, they:
-
Redesigned categorical encoding schemes to minimize correlations with protected attributes;
- Replaced zip code variables with more generalizable features about community economic indicators; and
- Implemented fairness constraints during feature transformation to ensure that encoded representations maintained fairness properties.
Throughout implementation, they maintained explicit focus on intersectional effects, ensuring that their mitigation strategies addressed the specific challenges faced by applicants at the intersection of multiple marginalized identities.
Outcomes and Lessons
The implementation resulted in several measurable improvements:
- Demographic representation disparities decreased by 78% across all protected groups.
- Statistical disparities in feature distributions between demographic groups were reduced by 64%.
- Model performance differences across demographic intersections decreased by 56%, while overall predictive accuracy was maintained.
Key challenges remained, including limited historical data for certain intersectional groups and some tension between regulatory requirements for model explainability and more complex fairness-promoting techniques.
The most generalizable lessons included:
- The importance of domain expertise in identifying historical bias patterns specific to financial services.
- The effectiveness of combining multiple complementary approaches (data augmentation, reweighting, and measurement expansion) rather than relying on a single intervention.
- The critical need for intersectional analysis throughout the process, as aggregate improvements sometimes masked persistent issues for specific intersectional groups.
These insights directly informed the development of the Bias Source Identification Tool, particularly in creating domain-specific evaluation questionnaires and establishing appropriate thresholds for representation requirements across different application contexts.
5. Frequently Asked Questions
FAQ 1: Measuring Representation Without Demographic Data
Q: How can I identify and address sampling and representation biases when my dataset lacks explicit demographic information due to privacy regulations or other constraints?
A: When demographic data are unavailable, you can implement proxy-based analysis, synthetic population comparison, and feature distribution analysis. Use geographically aggregated statistics (e.g., census tract data) as indirect measures, employ privacy-preserving techniques such as federated analysis on protected attributes, and examine distributional differences in supposedly neutral features across subpopulations. Document all assumptions and limitations of these approaches, and, where possible, validate findings through limited demographic audits on smaller, privacy-compliant samples.
FAQ 2: Distinguishing Data Bias From Societal Patterns
Q: When is a statistical disparity in my data a reflection of actual societal patterns versus a problematic bias that requires intervention?
A: This distinction requires both technical analysis and normative judgment. Technically, examine whether disparities persist after controlling for legitimate factors directly related to your prediction target. Analyze whether measurement validity differs across groups, indicating potential bias in how concepts are operationalized. From a normative perspective, assess whether observed patterns reflect historical inequities that your system should avoid perpetuating, even if statistically predictive. The key determination is whether the statistical patterns represent legitimate predictive signals for your specific task or reflect structural disadvantages that, if encoded in your model, would reproduce or amplify societal inequities.
6. Summary and Next Steps
Key Takeaways
Data collection and representation biases form the foundation of fairness issues in AI systems, as biased data inevitably lead to biased models regardless of subsequent interventions. The key concepts from this Unit include:
- Historical bias reflects past prejudices and discriminatory practices in the data, creating a foundation upon which subsequent biases build.
- Sampling bias occurs when data collection results in unrepresentative datasets that systematically disadvantage certain groups.
- Measurement bias emerges from the operationalization of concepts into measurable features in ways that embed unfair assumptions.
- Feature representation bias results from encoding and transformation choices that can amplify disparities across groups.
These concepts directly address our guiding questions by explaining how seemingly technical data decisions can embed bias and by providing systematic approaches to identify these issues before model development begins.
Application Guidance
To apply these concepts in your practical work:
- Begin any new ML project with a comprehensive data bias audit before model development.
- Document data collection processes, sampling procedures, and representation statistics as standard practice.
- Validate measurement approaches and feature encodings across demographic groups when demographic data are available.
- Implement bias mitigation strategies at the data level first, before attempting algorithmic interventions.
For organizations new to fairness considerations, start by focusing on basic representation analysis and documentation of data collection processes, then progressively incorporate more sophisticated analyses of measurement and encoding biases as capabilities mature.
Looking Ahead
In the next Unit, we will build on this foundation by examining algorithm design and implementation biases—the ways that modeling choices can introduce or amplify unfairness even with perfectly balanced data. You will learn how different learning algorithms, optimization objectives, and hyperparameter choices can create fairness issues, and how to identify these algorithmic bias sources systematically.
The data-level biases we have examined here often interact with algorithmic choices to create complex fairness challenges that neither data interventions nor algorithmic modifications alone can fully address. Understanding both components and their interactions is essential for developing truly effective fairness strategies.
References
Barocas, S., Hardt, M., & Narayanan, A. (2019). Fairness and machine learning: Limitations and opportunities. https://fairmlbook.org
Bolukbasi, T., Chang, K. W., Zou, J. Y., Saligrama, V., & Kalai, A. T. (2016). Man is to computer programmer as woman is to homemaker? Debiasing word embeddings. In Advances in Neural Information Processing Systems (pp. 4349–4357). https://papers.nips.cc/paper/2016/file/a486cd07e4ac3d270571622f4f316ec5-Paper.pdf
Buolamwini, J., & Gebru, T. (2018). Gender shades: Intersectional accuracy disparities in commercial gender classification. In Proceedings of the 1st Conference on Fairness, Accountability, and Transparency (pp. 77–91). https://proceedings.mlr.press/v81/buolamwini18a.html
Larson, J., Mattu, S., Kirchner, L., & Angwin, J. (2016). How we analyzed the COMPAS recidivism algorithm. ProPublica. https://www.propublica.org/article/how-we-analyzed-the-compas-recidivism-algorithm
Obermeyer, Z., Powers, B., Vogeli, C., & Mullainathan, S. (2019). Dissecting racial bias in an algorithm used to manage the health of populations. Science, 366(6464), 447–453. https://doi.org/10.1126/science.aax2342
Wilson, B., Hoffman, J., & Morgenstern, J. (2019). Predictive inequity in object detection. arXiv preprint arXiv:1902.11097. https://arxiv.org/abs/1902.11097
Unit 2
Unit 2: Algorithm Design and Implementation Biases
1. Conceptual Foundation and Relevance
Guiding Questions
- Question 1: How do algorithmic design choices and implementation decisions encode or amplify biases, even when using seemingly balanced training data?
- Question 2: What systematic approaches can you implement to identify and mitigate bias introduced through model architecture, optimization objectives, and hyperparameter choices?
Conceptual Context
While data biases often receive primary attention in fairness discussions, the algorithms that process this data introduce their own significant sources of bias. Even with perfectly balanced training data, the choices you make about model architecture, optimization objectives, loss functions, and hyperparameters can create or amplify unfairness through purely algorithmic mechanisms.
These algorithm design biases are particularly insidious because they often appear as technical implementation details rather than explicit fairness concerns. Decisions about which model architecture to use, how to define your loss function, or what regularization approach to apply can embed assumptions that systematically advantage certain groups over others without explicit intention. As Hooker (2021) demonstrated in her analysis of model compression techniques, seemingly neutral efficiency improvements like pruning can disproportionately impact performance on underrepresented groups, creating disparate outcomes through purely algorithmic mechanisms (Hooker, 2021).
This Unit builds directly on the data collection and representation biases examined in Unit 1, showing how algorithmic choices can compound or sometimes mitigate these earlier biases. It also establishes essential foundations for understanding feedback loops and amplification effects that we'll explore in Unit 3. The insights you develop here will directly inform the Bias Source Identification Methodology we will develop in Unit 5, particularly in identifying algorithm-level entry points where bias can infiltrate ML systems.
2. Key Concepts
Inductive Bias and Model Architecture Selection
Inductive bias—the set of assumptions that a learning algorithm uses to generalize from limited data—significantly influences how models perform across different population groups. This concept is fundamental to AI fairness because different model architectures encode different assumptions about how features relate to outcomes, which can align better with patterns in majority groups than in minority ones.
Inductive bias interacts with data representation biases by determining how effectively models can learn from limited or skewed representations of minority groups. The same dataset processed through different model architectures may produce varying levels of fairness based on how well each architecture's inductive biases align with underlying patterns for different groups.
Research by Urbanek et al. (2019) demonstrated how different model architectures processing identical datasets produced varying levels of gender bias in natural language processing tasks. Their work revealed that transformer-based models, recurrent neural networks, and convolutional architectures each encoded different patterns of gender associations despite training on the same text corpus, showing how architectural choices alone can influence fairness outcomes (Urbanek et al., 2019).
For the Bias Source Identification Methodology we'll develop in Unit 5, understanding inductive bias will be essential for determining how different model architectures might interact with other bias sources. This understanding enables more precise identification of where in the ML pipeline fairness issues originate and which interventions might be most effective.
The key insight is that model architectures are not neutral technical choices but rather encode specific assumptions that may work better for some groups than others. For instance:
- Linear models assume relationships between features and outcomes are linear, which may hold better for majority patterns with more training examples.
- Tree-based methods segment the feature space in ways that might create lower-quality splits for underrepresented groups with fewer samples.
- Deep learning architectures make implicit assumptions about data structure through their connectivity patterns, which might align differently with patterns in different demographic groups.
Optimization Objectives and Loss Functions
Optimization objectives and loss functions directly shape what models learn by defining what constitutes "good" performance. This concept is critical for AI fairness because standard objectives that maximize aggregate performance metrics often implicitly prioritize accuracy on majority groups at the expense of minority group performance.
These objectives interact with inductive bias by guiding how models leverage their architectural capabilities during learning. Together, they determine which patterns receive attention during optimization and which might be ignored as statistically insignificant despite their importance for minority groups.
Hashimoto et al. (2018) demonstrated how standard empirical risk minimization can lead to "representation disparity," where models progressively perform worse on minority groups as training proceeds. Their work showed that even when minority examples are present in training data, models optimized for average performance naturally focus on majority patterns that contribute more to the overall loss, gradually amplifying initial performance disparities (Hashimoto et al., 2018).
For our Bias Source Identification Methodology, understanding how optimization objectives contribute to bias will guide the development of systematic tests to identify whether performance disparities stem from loss function design rather than data issues or architectural limitations. This distinction is crucial for selecting appropriate mitigation strategies.
Standard loss functions that can introduce bias include:
- Mean squared error and cross-entropy loss: By averaging across all examples, these common losses implicitly weight majority group patterns more heavily.
- Accuracy maximization: Objectives that maximize overall accuracy can sacrifice minority group performance when these groups constitute a small percentage of the dataset.
- Proxy objectives: When direct optimization of target metrics is difficult, proxy objectives may correlate differently with desired outcomes across demographic groups.
Regularization and Hyperparameter Choices
Regularization approaches and hyperparameter selections, often viewed as purely technical tuning decisions, can significantly impact fairness by influencing which patterns models extract from data. This concept matters for AI fairness because these choices affect how models balance simplicity against fidelity to training data, which has disparate impacts across demographic groups.
Regularization interacts with both inductive bias and optimization objectives by constraining how models can leverage their architectural capabilities during learning and by shifting the balance between different components of the objective function. These interactions create complex patterns of advantage and disadvantage that standard hyperparameter tuning processes rarely consider.
Research by Kleinberg et al. (2018) illustrated how regularization can have disparate impacts across groups. Their analysis showed that L1 regularization, which promotes sparsity, often eliminates features that are predictive for minority groups but contribute less to overall model performance. Similarly, early stopping, a form of implicit regularization, can freeze models at points where majority group performance has converged but minority group performance is still improving (Kleinberg et al., 2018).
For the Bias Source Identification Methodology, understanding regularization impacts will help develop test cases that isolate how hyperparameter choices might contribute to observed disparities. This analysis can distinguish bias introduced during regularization from issues stemming from data or model architecture.
Common hyperparameter choices with fairness implications include:
- Regularization strength parameters (e.g., λ in L1/L2 regularization): Stronger regularization may disproportionately eliminate features important for minority groups.
- Learning rates and schedules: Different learning dynamics for majority versus minority patterns can make optimization path-dependent in ways that affect fairness.
- Model capacity parameters (e.g., tree depth, network width/depth): Capacity constraints may limit a model's ability to learn complex patterns specific to minority groups.
- Early stopping criteria: Stopping optimization based on aggregate metrics can halt training before minority group performance converges.
Evaluation Protocol Design
Evaluation protocol design—how models are tested, which metrics are prioritized, and how results are interpreted—significantly influences which fairness issues are detected and addressed. This concept is fundamental to AI fairness because evaluation choices determine which disparities become visible to practitioners and which remain hidden.
Evaluation protocols interact with all previously discussed algorithmic choices by determining how we measure their effects. Without appropriate evaluation across demographic groups, biases introduced through architecture, optimization, or regularization choices may go undetected despite significant impacts on minority groups.
Larson et al. (2017) demonstrated the importance of evaluation design in their analysis of natural language processing benchmarks. They showed how standard evaluation metrics often failed to capture performance disparities across demographic groups, creating an illusion of equal progress when improvements actually benefited some populations more than others. Their work emphasized the need for disaggregated evaluation protocols that explicitly assess performance across different demographic groups and intersections (Larson et al., 2017).
For our Bias Source Identification Methodology, understanding evaluation bias will guide the development of testing protocols that can detect algorithmic fairness issues even when they're not explicitly being sought. This awareness ensures that bias identification processes don't inherit the same blind spots as the systems they're designed to evaluate.
Key elements of evaluation protocols with fairness implications include:
- Test set composition: How representative testing data is across demographic groups directly affects which disparities become visible.
- Metric selection: Different evaluation metrics may highlight or obscure fairness issues based on what aspects of performance they measure.
- Significance testing: Statistical approaches for determining whether performance differences are meaningful may be underpowered for minority groups with fewer samples.
- Slice analysis: Whether evaluation examines performance on specific population subgroups or only in aggregate directly affects fairness visibility.
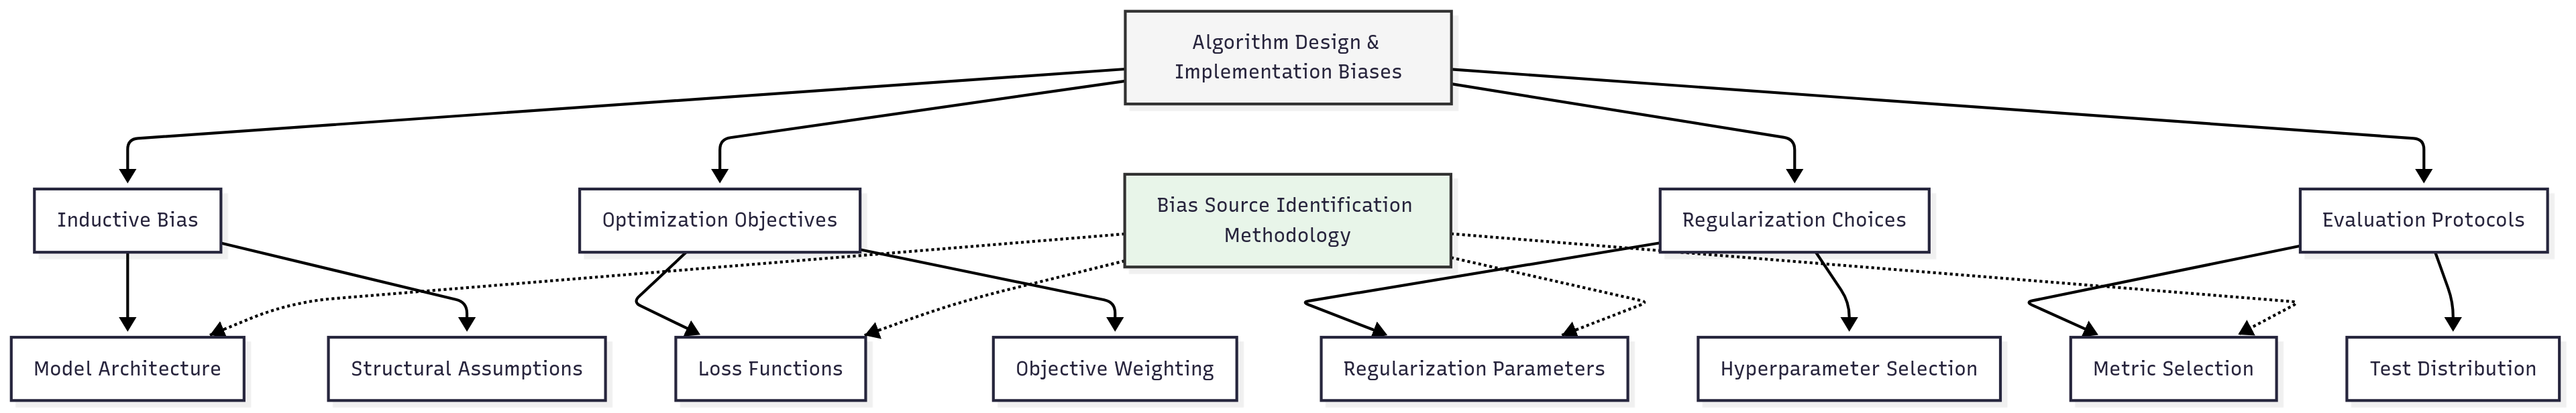
Domain Modeling Perspective
From a domain modeling perspective, algorithm design and implementation biases map to specific components of ML systems:
- Model Architecture Selection: How structural choices about model type and connectivity encode assumptions about data relationships.
- Loss Function Design: How performance objectives mathematically define what the model should optimize for.
- Regularization Framework: How constraints on model complexity influence which patterns are learned versus ignored.
- Hyperparameter Configuration: How technical tuning parameters balance various aspects of model behavior.
- Evaluation Infrastructure: How testing protocols and metrics assess performance across different population groups.
This domain mapping helps you systematically analyze how algorithmic choices at different stages of model development might introduce or amplify bias. The Bias Source Identification Methodology will leverage this mapping to create structured approaches for identifying algorithm-level bias sources throughout the development workflow.
Conceptual Clarification
To clarify these abstract algorithmic concepts, consider the following analogies:
- Inductive bias in model architectures functions like different grading rubrics teachers might use. Just as a rubric focused on multiple-choice questions versus one emphasizing essays would advantage students with different strengths, different model architectures naturally perform better on patterns that align with their structural assumptions. A linear model is like a rubric that only rewards simple, direct relationships, while a deep neural network is like a complex rubric that can reward intricate patterns—but might be applied inconsistently to unfamiliar cases.
- Optimization objectives and loss functions are similar to key performance indicators (KPIs) in business. When a company optimizes exclusively for a metric like total revenue, it might neglect smaller market segments that contribute little to the overall number despite their strategic importance. Similarly, when models optimize for aggregate performance metrics, they naturally focus on patterns common in majority groups that contribute more to the total loss, potentially underserving minority groups even when this creates significant relative disparities.
- Regularization and hyperparameter tuning resemble editorial policy in newspaper coverage. Just as editorial choices about article length and complexity affect which stories can be adequately covered (often disadvantaging complex issues affecting minority communities), regularization affects which patterns models can learn (often disadvantaging complex minority group patterns). Stronger regularization is like stricter word count limits—it may disproportionately constrain coverage of stories requiring nuanced explanation, just as it may eliminate features particularly important for understanding minority group patterns.
Intersectionality Consideration
Algorithm design biases present unique challenges for intersectional fairness, where multiple protected attributes interact to create distinct patterns that affect individuals with overlapping marginalized identities. Models optimized for aggregate performance or even single-attribute fairness may still perform poorly on intersectional subgroups due to both data limitations and algorithmic mechanisms.
As demonstrated by Kearns et al. (2018) in their work on "fairness gerrymandering," algorithms can satisfy fairness constraints with respect to individual protected attributes while still discriminating against specific intersectional subgroups. Their research showed that standard approaches to algorithmic fairness often failed to protect individuals at the intersection of multiple marginalized identities, revealing the need for explicitly intersectional fairness formulations (Kearns et al., 2018).
Addressing intersectional considerations in algorithm design requires:
- Model architectures that can effectively learn from smaller intersectional subgroups despite limited samples;
- Loss functions that balance performance across both high-level groups and their intersections;
- Regularization approaches that preserve important features for intersectional subgroups despite their statistical minority status; and
- Evaluation protocols that explicitly assess performance across demographic intersections, not just along individual protected attributes.
The Bias Source Identification Methodology must incorporate these intersectional considerations by developing analysis approaches that systematically examine algorithm performance across demographic intersections, even when these groups constitute small minorities in the dataset.
3. Practical Considerations
Implementation Framework
To systematically identify and address algorithm-level biases, implement the following structured methodology:
-
Model Architecture Analysis:
-
Examine how different model architectures perform across demographic groups with the same training data.
- Analyze whether architectural assumptions align with patterns present in minority groups.
- Test whether increasing model capacity differentially improves performance across groups.
-
Document architecture-specific fairness implications to inform selection decisions.
-
Loss Function Evaluation:
-
Decompose performance metrics by demographic group to identify disparate optimization patterns.
- Analyze convergence trajectories to determine whether minority group performance plateaus later than majority groups.
- Test modified loss functions that give equal weight to examples regardless of group size.
-
Implement group-aware losses that explicitly balance performance across demographic categories.
-
Regularization Impact Assessment:
-
Compare feature importance across demographic groups before and after regularization.
- Analyze how different regularization parameters affect performance disparities.
- Implement group-specific regularization to account for different sample sizes.
-
Document how early stopping points affect the fairness-performance frontier.
-
Evaluation Protocol Design:
-
Implement disaggregated evaluation that examines performance across both protected attributes and their intersections.
- Develop statistical approaches appropriate for different group sizes.
- Create performance dashboards that highlight disparities across multiple metrics.
- Establish minimum performance thresholds for all demographic groups rather than just in aggregate.
These methodologies integrate with standard ML workflows by extending model selection, optimization, and evaluation processes to explicitly incorporate fairness considerations. While they add analytical complexity, they leverage many existing practices while orienting them toward detecting and addressing algorithmic sources of bias.
Implementation Challenges
When implementing these approaches, practitioners commonly encounter the following challenges:
-
Performance-Fairness Trade-offs: More complex architectures or fairness-aware losses may reduce aggregate performance. Address this by:
-
Developing clear documentation of trade-off frontiers to inform stakeholder discussions;
- Implementing multi-objective optimization approaches that explicitly balance competing goals; and
-
Creating evaluation frameworks that assess both standard performance and fairness metrics in context.
-
Limited Samples for Algorithmic Analysis: Some demographic groups may have too few examples to reliably assess algorithmic impacts. Address this by:
-
Implementing synthetic data approaches to test algorithmic behavior under controlled conditions;
- Using transfer learning from related domains with more balanced data to isolate algorithmic effects; and
- Applying statistical techniques specifically designed for small sample inference.
Successfully implementing algorithm bias analysis requires computational resources for testing multiple model configurations, expertise in both machine learning and fairness evaluation, and organizational willingness to potentially sacrifice some aggregate performance for more equitable outcomes across groups.
Evaluation Approach
To assess whether your algorithm bias identification and mitigation approaches are effective, implement these evaluation strategies:
-
Architecture Fairness Assessment:
-
Calculate performance disparities across demographic groups for different model architectures using identical training data.
- Establish acceptable disparity thresholds based on domain-specific requirements.
-
Compare disparities before and after architecture modifications to quantify improvements.
-
Optimization Fairness Metrics:
-
Track performance trajectories by demographic group throughout training.
- Measure whether loss reductions are balanced across groups or concentrated in majority populations.
-
Evaluate whether fairness-aware losses reduce disparities compared to standard objectives.
-
Regularization Equity Analysis:
-
Assess whether regularization disproportionately affects features important to specific demographic groups.
- Compare performance disparities across different regularization strategies and parameters.
- Measure the impact of custom regularization approaches designed to preserve minority group features.
These metrics should be integrated with your organization's broader fairness assessment framework, providing inputs to comprehensive bias source identification processes that span the entire ML lifecycle.
4. Case Study: Content Recommendation System
Scenario Context
A digital media company is developing a content recommendation algorithm to personalize article suggestions for users on their news platform. The system analyzes user behavior, content characteristics, and contextual factors to predict engagement likelihood. Key stakeholders include product managers focused on increasing overall engagement, editorial teams concerned about content diversity, users from various demographic backgrounds seeking relevant information, and business leaders monitoring revenue implications.
Fairness is particularly critical in this context because recommendation algorithms shape information access, potentially creating filter bubbles or unequal access to opportunities based on user demographics. The company wants to ensure their algorithm provides high-quality recommendations to all user groups while maintaining strong overall engagement metrics.
Problem Analysis
Applying core concepts from this Unit reveals several potential algorithm-level biases in the recommendation system scenario:
- Inductive Bias and Architecture: Initial testing revealed that the matrix factorization architecture initially selected for the recommendation system created larger performance gaps across demographic groups than a graph neural network architecture using identical training data. Analysis showed that matrix factorization's linear embedding assumptions worked well for users with extensive interaction histories (predominantly from majority demographic groups) but struggled with users having sparse interaction patterns (more common among minority users and new users from all demographics).
- Optimization Objectives: The team had initially defined their loss function to maximize click-through rate (CTR) across all recommendations. Disaggregated analysis revealed this objective led to progressively worsening recommendations for minority groups during training, as the model focused on patterns that improved majority group engagement at the expense of minority group experience. While overall CTR improved, the disparity between demographic groups increased by 45% after optimization.
- Regularization Effects: Standard L2 regularization applied to control overfitting had disproportionate effects across user groups. Stronger regularization improved performance for majority groups by preventing overfitting to noise, but simultaneously eliminated subtle but important patterns for minority groups where limited data made legitimate signals statistically similar to noise. This created an implicit trade-off where regularization strength that was optimal for majority groups systematically underserved minority users.
- Evaluation Protocol Issues: The standard A/B testing framework evaluated new algorithm versions based on aggregate engagement metrics without disaggregation by demographic groups. This approach had repeatedly approved algorithm changes that improved overall metrics while degrading the experience for specific user segments, as improvements for majority users outweighed regressions for minority groups in aggregate statistics.
From an intersectional perspective, the most severe performance disparities affected users at specific demographic intersections—for instance, older users from minority racial backgrounds showed recommendation quality significantly worse than would be predicted by examining either age or racial factors independently.
Solution Implementation
To address these identified algorithm-level biases, the team implemented a structured approach:
-
For Architecture Bias, they:
-
Conducted a systematic comparison of different architectures including matrix factorization, factorization machines, and graph neural networks;
- Selected a hybrid architecture combining the strengths of multiple approaches to better serve diverse user interaction patterns; and
-
Implemented separate embedding dimensions for different user segments to account for varying data density and pattern complexity.
-
For Optimization Objectives, they:
-
Redesigned their loss function to explicitly balance performance across demographic groups;
- Implemented a multi-objective approach that considered both overall engagement and equity across groups; and
-
Added constraints to ensure minimum quality standards for all user segments regardless of size.
-
For Regularization Impacts, they:
-
Implemented adaptive regularization that adjusted strength based on data quantity for different user groups;
- Created feature importance preservation mechanisms to maintain predictive patterns for minority groups despite limited statistical power; and
-
Designed custom early stopping criteria that monitored convergence across demographic segments rather than just in aggregate.
-
For Evaluation Protocols, they:
-
Redesigned their testing framework to automatically disaggregate results across demographic dimensions;
- Implemented statistical tests appropriate for different sample sizes across groups; and
- Created fairness-specific dashboards highlighting disparities alongside traditional performance metrics.
Throughout implementation, they maintained explicit focus on intersectional effects, ensuring that their algorithmic improvements addressed the specific challenges faced by users at the intersection of multiple demographic factors.
Outcomes and Lessons
The implementation resulted in significant improvements across multiple dimensions:
- The hybrid architecture reduced performance disparities across demographic groups by 62% while maintaining strong overall engagement metrics.
- The revised loss function prevented the progressive degradation of minority group recommendations during training.
- Adaptive regularization preserved important features for minority groups that standard approaches would have eliminated.
- The new evaluation framework successfully identified and prevented changes that would have created disparate impacts despite improving aggregate metrics.
Key challenges remained, including tensions between different fairness objectives and the computational complexity of more sophisticated architectural approaches.
The most generalizable lessons included:
- The critical importance of testing multiple model architectures with identical data to isolate purely algorithmic sources of bias.
- The significant impact of loss function design on how models balance performance across different user groups during optimization.
- The need for regularization approaches that account for different data characteristics across demographic groups rather than applying uniform constraints.
These insights directly informed the development of the Bias Source Identification Methodology, particularly in creating systematic tests to distinguish algorithm-level biases from data issues and in establishing appropriate evaluation approaches for different bias sources.
5. Frequently Asked Questions
FAQ 1: Distinguishing Algorithm Bias From Data Bias
Q: How can I determine whether observed fairness disparities stem from algorithm design choices rather than biases in the training data?
A: Isolate algorithmic effects by systematically varying model components while keeping training data constant. Compare performance disparities across different architectures, optimization objectives, and regularization approaches using identical datasets. If disparities change significantly based on algorithmic choices alone, this indicates algorithm-level bias contributions. Additionally, create synthetic experiments where you introduce controlled biases into otherwise balanced data to measure how different algorithms respond to known data issues. Track how performance disparities evolve during training—if gaps increase during optimization despite balanced initial predictions, this suggests the optimization process itself is amplifying minor initial differences. Finally, analyze feature importance across demographic groups before and after training to determine whether the algorithm systematically undervalues features important for minority groups.
FAQ 2: Fairness-Performance Trade-offs in Algorithm Design
Q: When more complex or fairness-aware algorithms reduce overall performance metrics, how should I navigate these trade-offs with stakeholders?
A: First, quantify the exact nature of the trade-offs by mapping the Pareto frontier showing potential operating points balancing performance and fairness. This transforms an abstract discussion into a concrete decision about where on this frontier the organization wishes to operate. Frame fairness not as a constraint on performance but as an additional quality dimension, similar to how robustness or interpretability might be considered alongside accuracy. Connect fairness considerations to specific business risks—including legal liability, reputational damage, and lost market opportunities in underserved segments—to contextualize short-term metric impacts. Develop disaggregated metrics that show both overall performance and performance for specific groups, making disparities explicit rather than hidden in aggregates. Finally, propose incremental adoption approaches that gradually improve fairness while managing performance impacts through controlled deployment.
6. Summary and Next Steps
Key Takeaways
Algorithmic design and implementation choices introduce distinct sources of bias beyond any issues present in the training data. The key concepts from this Unit include:
- Inductive bias in model architectures influences which patterns models can effectively learn, potentially creating disparate performance when architectural assumptions align better with majority group patterns than minority ones.
- Optimization objectives and loss functions shape how models balance performance across groups during training, often implicitly prioritizing majority group patterns that contribute more to aggregate metrics.
- Regularization and hyperparameter choices affect which features and patterns are preserved versus eliminated, potentially disadvantaging minority groups with limited samples or complex predictive patterns.
- Evaluation protocol design determines which disparities become visible during testing, with standard approaches often obscuring performance issues affecting specific demographic groups.
These concepts directly address our guiding questions by explaining how algorithmic choices encode or amplify biases even with balanced data and by providing systematic approaches to identify and mitigate these purely algorithmic sources of unfairness.
Application Guidance
To apply these concepts in your practical work:
- Test multiple model architectures with identical training data to isolate architecture-specific fairness effects.
- Decompose loss function optimization by demographic group to identify disparate convergence patterns.
- Analyze the impact of regularization and hyperparameters on different demographic groups rather than just on aggregate performance.
- Implement disaggregated evaluation protocols that assess performance across both individual protected attributes and their intersections.
For organizations new to algorithmic fairness considerations, start by implementing basic disaggregated evaluation across demographic groups for your existing models. This baseline analysis will help identify where disparities exist, allowing you to progressively implement more sophisticated architecture comparisons, loss function analyses, and regularization assessments as your capabilities mature.
Looking Ahead
In the next Unit, we will build on this foundation by examining feedback loops and amplification effects that can magnify initial biases over time. You will learn how model outputs influence future data collection, how algorithmic decisions can create reinforcing cycles of disadvantage, and how to identify systems at high risk for runaway bias amplification.
The algorithm-level biases we have examined here often serve as the initial seeds for these feedback effects, with small algorithmic disparities potentially growing into significant fairness issues through repeated application and data recollection. Understanding both static algorithmic biases and dynamic feedback effects is essential for developing comprehensive fairness strategies that remain effective over time.
References
Hashimoto, T. B., Srivastava, M., Namkoong, H., & Liang, P. (2018). Fairness without demographics in repeated loss minimization. In Proceedings of the 35th International Conference on Machine Learning (pp. 1929-1938). http://proceedings.mlr.press/v80/hashimoto18a.html
Hooker, S. (2021). Moving beyond "algorithmic bias is a data problem". Patterns, 2(4), 100241. https://doi.org/10.1016/j.patter.2021.100241
Kearns, M., Neel, S., Roth, A., & Wu, Z. S. (2018). Preventing fairness gerrymandering: Auditing and learning for subgroup fairness. In Proceedings of the 35th International Conference on Machine Learning (pp. 2564-2572). http://proceedings.mlr.press/v80/kearns18a.html
Kleinberg, J., Ludwig, J., Mullainathan, S., & Rambachan, A. (2018). Algorithmic fairness. AEA Papers and Proceedings, 108, 22-27. https://doi.org/10.1257/pandp.20181018
Larson, J., Mattu, S., Kirchner, L., & Angwin, J. (2017). How we analyzed the COMPAS recidivism algorithm. ProPublica. https://www.propublica.org/article/how-we-analyzed-the-compas-recidivism-algorithm
Urbanek, J., Kannan, A., Kamath, A., Lobez, J. I., & DeFour, M. (2019). Comparing model architectures for NLP fairness. arXiv preprint arXiv:1911.01485. https://arxiv.org/abs/1911.01485
Unit 3
Unit 3: Feedback Loops and Amplification Effects
1. Conceptual Foundation and Relevance
Guiding Questions
- Question 1: How do feedback loops in AI systems transform initial biases into progressively larger disparities over time?
- Question 2: What technical mechanisms can data scientists implement to detect, measure, and interrupt harmful feedback dynamics before they create significant fairness violations?
Conceptual Context
Feedback loops represent one of the most pernicious mechanisms through which initially small biases can transform into significant fairness problems in AI systems. While static bias sources in data or algorithms create constant disparities, feedback dynamics can generate exponentially growing disparities as systems influence the environments they observe, creating a self-reinforcing cycle of inequity.
These feedback mechanisms are particularly dangerous because they often operate invisibly, with seemingly minor initial disparities compounding over time through multiple iterations of model deployment and data collection. As Ensign et al. (2018) demonstrate in their analysis of predictive policing algorithms, feedback loops can create a "runaway" effect where the model's own predictions shape future data in ways that confirm and amplify initial biases, regardless of underlying ground truth (Ensign et al., 2018).
This Unit builds directly on the data collection and representation biases explored in Units 1-2 by examining how these initial biases can be magnified through system dynamics rather than remaining static. It establishes essential foundations for understanding deployment biases in Unit 4 by focusing on the iterative processes through which models interact with their environments over time. The insights you develop here will directly inform the Bias Source Identification Tool in Unit 5, particularly in identifying dynamic bias sources that emerge through system operation rather than existing in any single component.
2. Key Concepts
Runaway Feedback Effects
Runaway feedback effects occur when an AI system's predictions influence future data collection in ways that systematically reinforce and amplify the system's existing patterns, creating a self-fulfilling prophecy that progressively diverges from ground truth. This concept is crucial for AI fairness because these self-reinforcing cycles can transform small initial biases into significant disparities over time, often operating invisibly until substantial harm has occurred.
Runaway feedback connects directly to data bias concepts from previous Units, showing how representation disparities can become progressively worse through system operation rather than remaining static. This dynamic view complements the static analysis of bias sources by revealing how initial biases evolve over time.
Research by Ensign et al. (2018) provides a powerful application example in predictive policing, demonstrating mathematically how these algorithms can create feedback loops that reinforce initial biases. Their study showed that when police are dispatched based on predictions from historical arrest data, new arrests occur disproportionately in already over-policed neighborhoods. These new arrests then enter the historical data, strengthening the pattern that led to their prediction and creating a self-reinforcing cycle disconnected from actual crime rates (Ensign et al., 2018).
Similar dynamics appear in content recommendation systems, where initial disparities in content exposure lead to differential engagement patterns, which then inform future recommendations in a reinforcing cycle. For example, an educational content recommendation system showing slight initial bias toward traditionally "male" subjects for boys and "female" subjects for girls will collect engagement data shaped by these initial recommendations, potentially creating increasingly gender-stereotyped content exposure over time.
For the Bias Source Identification Tool we will develop, understanding runaway feedback effects helps identify dynamic bias sources that emerge through system operation rather than existing in static components. This perspective guides the development of monitoring approaches that track disparity growth over time rather than just measuring bias at a single point.
Feedback Loop Typology
Feedback loops in AI systems can be categorized into distinct types based on their operational mechanisms, information flows, and fairness implications. Understanding this typology is essential for AI fairness because different feedback types require specific detection and mitigation approaches tailored to their particular dynamics.
This typology interacts with runaway feedback effects by providing a structured framework for analyzing how different feedback mechanisms lead to bias amplification. It also connects to subsequent concepts by identifying specific points where monitoring or intervention might be most effective.
As established by Mansoury et al. (2020) in their analysis of recommendation systems, we can distinguish between several feedback types:
- Direct Feedback Loops occur when a system's outputs directly influence future inputs in the same decision stream. For example, a content recommendation algorithm suggesting certain items leads to user engagement with those items, which then reinforces those recommendation patterns.
- Indirect Feedback Loops involve a system's outputs influencing future inputs through intermediate mechanisms or external systems. For instance, an automated resume screening tool might influence which candidates receive interview training, affecting their performance in future application processes.
- User-Driven Feedback emerges from how users interact with and adapt to an AI system over time. For example, users may learn to use specific keywords to achieve desired outcomes from search algorithms, creating distribution shifts that affect system performance.
- System-Driven Feedback occurs when the AI system itself evolves in response to new data without explicit user adaptation. For instance, continual learning systems that automatically update based on new observations can develop increasingly biased patterns without direct user input.
Understanding these distinct feedback mechanisms is critical for effective bias mitigation. For example, mitigating direct feedback loops might involve randomization techniques to break self-reinforcing cycles, while addressing user-driven feedback requires monitoring for strategic adaptation patterns across different user groups.
For our Bias Source Identification Tool, this typology will guide the development of specific detection techniques for different feedback mechanisms, ensuring comprehensive coverage of dynamic bias sources across system types.
Measurement and Detection Approaches
Detecting and measuring feedback-induced bias amplification requires specialized techniques beyond static fairness metrics, as the key concern is how disparities evolve over time rather than their magnitude at any specific moment. These measurement approaches are essential for AI fairness because they enable early detection of potentially harmful feedback dynamics before they create significant disparities.
Measurement approaches connect to the feedback typology by providing specific techniques for quantifying different feedback mechanisms. They also establish the foundation for intervention strategies by identifying when and how to interrupt harmful feedback cycles.
Research by Hashimoto et al. (2018) demonstrates several approaches for measuring feedback-induced disparities, including:
- Disparity Growth Rate Analysis tracks the change in fairness metrics over multiple system iterations, focusing on the rate of change rather than absolute values. This approach can detect exponential growth patterns characteristic of runaway feedback.
- Counterfactual Simulation involves running simulations with and without feedback mechanisms to isolate their specific effects on different groups. These simulations can reveal how initially small disparities might evolve under continued system operation.
- Distribution Shift Monitoring examines how input data distributions change over time in response to system outputs, with particular attention to whether these shifts differ across demographic groups.
- Causal Analysis of Feedback Paths identifies and quantifies specific causal mechanisms through which system outputs influence future inputs, often using intervention experiments that deliberately break potential feedback paths.
As Hashimoto et al. (2018) demonstrated in their analysis of natural language processing systems, these measurement approaches can reveal "performative prediction" effects where model outputs influence future data in ways that create increasingly biased patterns over time. Their research showed how initially minor representation disparities in language models progressively worsen through feedback dynamics, as underrepresented groups receive worse model performance, potentially reducing their system usage and further diminishing their representation in training data (Hashimoto et al., 2018).
For the Bias Source Identification Tool, these measurement approaches will form a critical component for detecting dynamic bias sources that emerge through system operation. The framework will include specific methodologies for implementing these measurements across different AI applications and system architectures.
Intervention Strategies for Breaking Harmful Cycles
Once harmful feedback loops are identified, specific technical interventions can break these cycles before they create significant fairness violations. These intervention strategies are crucial for AI fairness because they provide concrete mechanisms for preventing bias amplification in systems where feedback dynamics are unavoidable.
Intervention strategies build directly on measurement approaches by using detection insights to implement targeted solutions. They represent the actionable component that follows from understanding feedback mechanisms and their potential harms.
Research by D'Amour et al. (2020) and others has established several effective intervention strategies:
- Strategic Randomization introduces controlled randomness into model outputs to prevent self-reinforcing patterns from becoming entrenched. For example, exploration parameters in recommendation systems can ensure diverse content exposure despite initial popularity disparities.
- Periodic Distribution Alignment explicitly corrects for distribution shifts by reweighting or resampling training data to match target distributions, preventing progressive drift due to feedback effects.
- Causal Intervention specifically targets and modifies the causal mechanisms through which system outputs influence future inputs, breaking harmful feedback paths while maintaining beneficial ones.
- Multi-stakeholder Optimization incorporates the welfare of all system participants into the objective function, preventing feedback dynamics that benefit certain groups at others' expense.
D'Amour et al. (2020) demonstrated these approaches in their work on performative prediction, showing how strategic modifications to learning algorithms can prevent harmful feedback cycles in systems ranging from credit scoring to content recommendation. Their research established that simple interventions like periodic retraining with distribution constraints can significantly reduce bias amplification while maintaining overall system performance (D'Amour et al., 2020).
For our Bias Source Identification Tool, these intervention strategies will provide critical guidance on how to address dynamic bias sources once they are detected. The framework will connect specific feedback mechanisms to appropriate intervention approaches, enabling targeted solutions rather than generic fairness constraints.
Domain Modeling Perspective
From a domain modeling perspective, feedback loops and amplification effects map to specific components of ML systems:
- Data Collection Mechanism: How system outputs influence which new data points are collected and with what frequency.
- Labeling Process: How current model predictions affect the labels assigned to future training examples.
- Feature Distribution: How system-influenced behaviors change the distribution of features in future inputs.
- Update Mechanism: How new data is incorporated into model training and how the model evolves over time.
- Decision Threshold Dynamics: How decision thresholds adapt to changing data distributions influenced by the system itself.
This domain mapping helps understand how feedback loops operate through specific technical components rather than viewing them as abstract phenomena. The Bias Source Identification Tool will leverage this mapping to identify concrete points where feedback can be measured and interrupted within the ML lifecycle.
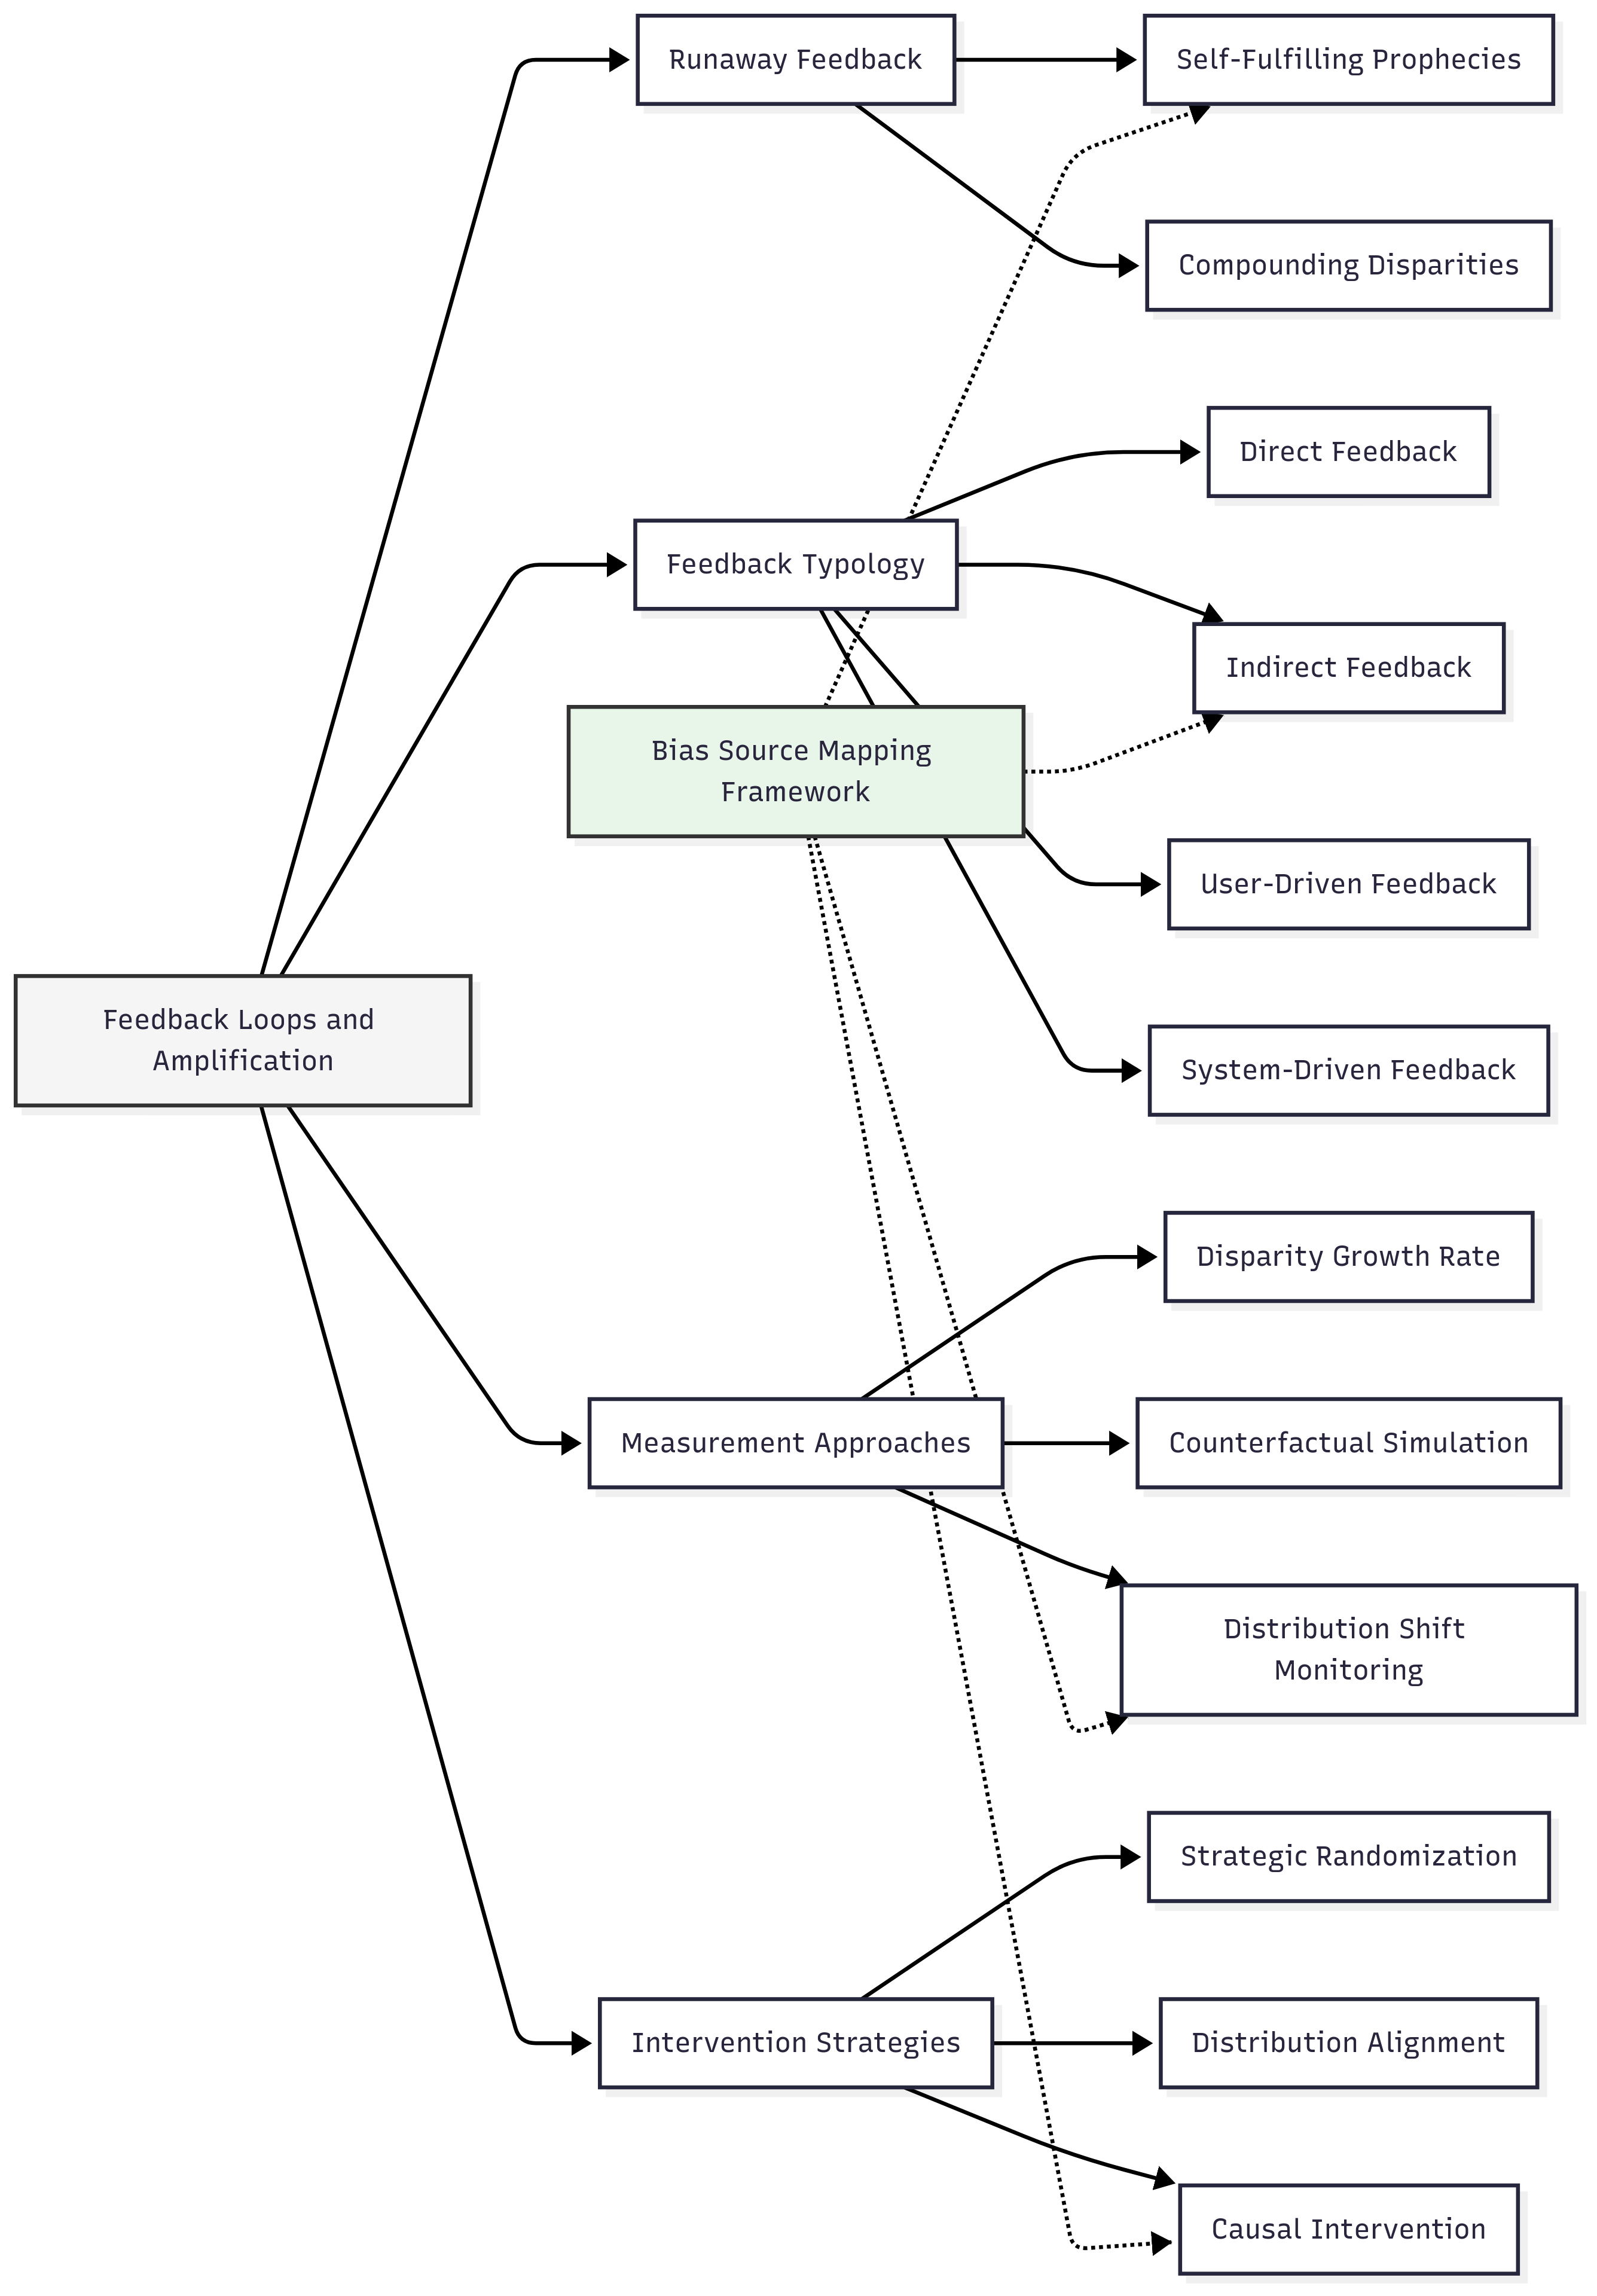
Conceptual Clarification
To clarify these abstract concepts, consider the following analogies:
- Feedback loops in AI systems function like compound interest in financial systems. Just as a small initial investment can grow exponentially through the continuous reinvestment of interest, small initial biases in AI systems can amplify dramatically when system outputs systematically influence future inputs. In both cases, the critical dynamic is that each cycle builds upon the results of previous cycles, creating exponential rather than linear effects over time. This compounding dynamic explains why seemingly minor initial disparities can become significant fairness problems through iterative system operation.
- The different feedback types can be understood through water flow analogies. Direct feedback loops are like a water pump that recirculates water within a single pool—what comes out immediately goes back in, quickly changing the pool's composition. Indirect feedback loops resemble a connected pond system where changes in one pond eventually affect others through connecting streams, creating more complex and delayed effects. User-driven feedback is similar to people adjusting their water usage based on observed reservoir levels, while system-driven feedback resembles automated dam systems that adjust water flow based on predetermined rules without human intervention.
- Intervention strategies parallel techniques used to prevent audio feedback in sound systems (the unpleasant screeching when a microphone picks up its own amplified output). Just as sound engineers use frequency filters, microphone placement adjustments, and controlled dampening to prevent harmful audio feedback cycles, data scientists can implement strategic randomization, distribution alignment, and causal interventions to prevent harmful feedback cycles in AI systems. In both domains, the goal is not to eliminate all feedback (which would make the system non-functional) but to prevent specific harmful feedback patterns while maintaining desired system behaviors.
Intersectionality Consideration
Feedback loops present unique challenges for intersectional fairness analysis, as amplification effects often manifest differently across intersecting identity dimensions, creating complex patterns that single-attribute analyses miss. Traditional fairness monitoring that examines protected attributes separately may fail to detect feedback-induced disparities that specifically affect intersectional subgroups.
For example, research by Ekstrand et al. (2018) on recommendation systems demonstrated that feedback loops can create particularly severe disparities for users at specific intersections of gender, age, and cultural background—patterns that were not evident when examining these attributes independently. Their analysis showed how recommendation accuracy initially differed subtly across demographic dimensions, but these differences amplified dramatically at certain intersections through feedback cycles, as reduced recommendation quality led to reduced engagement, which further diminished recommendation personalization (Ekstrand et al., 2018).
The practical implications of these intersectional effects include:
- Feedback loop detection requires explicitly intersectional measurement approaches that track disparity evolution across demographic combinations, not just individual protected attributes.
- Simulation models for predicting feedback effects must incorporate intersectional user behavior patterns rather than assuming uniform responses across demographic categories.
- Intervention strategies must address the specific feedback mechanisms that create heightened disparities at demographic intersections, potentially requiring customized approaches for different intersectional groups.
- System monitoring must maintain granular tracking of performance across intersectional categories, with heightened sensitivity to early warning signs of disparity growth in historically vulnerable intersectional groups.
The Bias Source Identification Tool must explicitly address these intersectional considerations by incorporating analytical approaches that detect, measure, and mitigate feedback-induced disparities across demographic intersections rather than treating protected attributes in isolation.
3. Practical Considerations
Implementation Framework
To systematically detect and address feedback loops in AI systems, implement this structured methodology:
-
Feedback Path Identification:
-
Map all pathways through which system outputs might influence future inputs.
- Classify identified feedback paths according to the feedback typology (direct, indirect, user-driven, system-driven).
- Estimate potential disparity amplification risks for each path based on initial bias measurements.
-
Prioritize high-risk feedback paths for detailed monitoring and potential intervention.
-
Dynamic Disparity Measurement:
-
Implement time-series tracking of fairness metrics across system iterations.
- Calculate disparity growth rates to identify exponential amplification patterns.
- Conduct counterfactual simulations that isolate feedback effects from other factors.
-
Measure distribution shifts in both feature spaces and outcome variables across demographic groups.
-
Feedback Intervention Design:
-
Select appropriate intervention strategies based on feedback type and system constraints.
- Implement targeted randomization to prevent self-reinforcing patterns in high-risk areas.
- Design distribution monitoring and correction mechanisms that trigger automatically when shifts exceed thresholds.
-
Develop causal intervention approaches that modify specific feedback mechanisms without compromising overall system functionality.
-
Continuous Monitoring:
-
Establish automated alerts for accelerating disparity growth rates.
- Implement A/B testing frameworks that compare system versions with different feedback intervention strategies.
- Track long-term disparity evolution to verify intervention effectiveness.
- Document observed feedback patterns to inform future system designs.
These methodologies integrate with standard ML workflows by extending traditional static fairness evaluation to include dynamic monitoring and intervention. While adding complexity to system design and evaluation, these approaches prevent the significant fairness violations and potential legal liabilities that can emerge from unchecked feedback loops.
Implementation Challenges
When implementing feedback analysis and intervention, practitioners commonly face these challenges:
-
Limited Data on System Dynamics: Many organizations lack sufficient longitudinal data to identify feedback patterns. Address this by:
-
Implementing structured logging systems that track both model outputs and subsequent data collection;
- Developing simulation environments that predict potential feedback effects before full deployment; and
-
Starting with focused monitoring of high-risk feedback paths rather than attempting comprehensive coverage immediately.
-
Tension Between Intervention and Performance: Interventions that break harmful feedback loops can sometimes reduce short-term system performance. Address this by:
-
Framing feedback intervention as risk management that prevents long-term performance degradation;
- Designing targeted interventions that address specific harmful dynamics rather than applying generic constraints; and
- Developing metrics that capture both immediate performance and long-term stability to demonstrate intervention value.
Successfully implementing feedback analysis requires computational resources for simulation and monitoring, longitudinal data capturing system behavior over multiple iterations, and cross-functional collaboration between data scientists, domain experts, and stakeholders who can identify potential feedback mechanisms beyond technical components.
Evaluation Approach
To assess whether your feedback loop analysis and intervention is effective, implement these evaluation strategies:
-
Disparity Growth Rate Comparison:
-
Calculate and compare disparity growth rates before and after intervention.
- Establish acceptable thresholds for maximum growth rates across different metrics.
-
Verify that growth rates remain within bounds over extended periods, not just immediately after intervention.
-
Counterfactual Performance Analysis:
-
Simulate system performance with and without feedback interventions.
- Measure both short-term performance impact and long-term disparity evolution.
-
Quantify the trade-off between immediate performance and feedback mitigation.
-
Distribution Stability Assessment:
-
Track key data distribution statistics over time to verify stability.
- Compare distribution drift rates across demographic groups to ensure equitable stability.
- Document distribution change points and correlate them with system modifications.
These evaluation approaches should connect to your organization's broader fairness assessment framework, providing dynamic analysis that complements static fairness metrics and identifies emerging risks before they create significant disparities.
4. Case Study: Content Recommendation System
Scenario Context
A digital education platform uses a machine learning recommendation system to suggest learning materials to students based on their past engagement patterns, learning goals, and performance. The system aims to personalize the educational experience by recommending content that matches each student's interests and learning pace. Key stakeholders include students seeking effective learning resources, educators concerned with comprehensive educational coverage, platform developers focused on engagement metrics, and education policy experts monitoring equity in educational access.
Fairness is particularly critical in this domain because educational recommendations directly influence learning opportunities and outcomes, with potential long-term impacts on students' academic development and career trajectories. The recommendation system must balance personalization with ensuring equitable access to high-quality educational resources across different student demographics.
Problem Analysis
Applying core concepts from this Unit reveals several potential feedback loop concerns in the education recommendation system:
- Runaway Feedback Effects: Analysis of six months of historical data reveals that students who initially received recommendations for advanced content showed progressively increasing engagement, leading to more advanced recommendations, while students who initially received basic content recommendations showed declining engagement over time. This pattern suggests a runaway feedback effect where initial recommendation differences are amplifying rather than correcting over time.
-
Feedback Typology Analysis: Several feedback mechanisms are identified:
-
Direct Feedback: Student engagement with recommended content directly influences future recommendations.
- Indirect Feedback: Content mastery unlocks new content areas, creating path dependencies in learning trajectories.
- User-Driven Feedback: Students adapt their behavior based on recommendation patterns, sometimes avoiding content categories where they receive fewer recommendations.
-
System-Driven Feedback: The recommendation algorithm continuously updates based on aggregate engagement patterns, potentially amplifying popular content categories.
-
Measurement Reveals Demographic Disparities: Applying disparity growth rate analysis shows that recommendation diversity is declining 37% faster for students from lower socioeconomic backgrounds. Distribution shift monitoring reveals that STEM content exposure is growing for male students while remaining stable for female students, creating a widening gender gap in STEM content recommendations that was not apparent in static fairness metrics.
- Intersectional Effects: The most severe feedback effects appear at specific intersections, with female students from lower socioeconomic backgrounds showing the steepest decline in advanced content recommendations—a pattern not fully visible when analyzing either gender or socioeconomic status independently.
These findings suggest that while the recommendation system appears reasonably fair in static analysis, feedback dynamics are creating progressively larger disparities that could significantly impact educational outcomes if not addressed.
Solution Implementation
To address these identified feedback concerns, the education platform implemented a structured intervention approach:
-
For Runaway Feedback Effects, they:
-
Implemented a "learning trajectory balancing" algorithm that counteracts self-reinforcing cycles by periodically boosting recommendations for content categories showing declining engagement;
- Created disparity growth rate dashboards that track how quickly content exposure diverges across student groups; and
-
Established maximum thresholds for acceptable disparity growth, with automatic alerts when these thresholds are approached.
-
For Feedback Type-Specific Interventions, they:
-
Addressed direct feedback by implementing strategic exploration parameters that ensure minimum exposure to diverse content categories regardless of past engagement;
- Mitigated indirect feedback by creating multiple learning pathways to advanced content, preventing path dependency; and
-
Countered system-driven feedback by regularly rebalancing the training data to maintain consistent demographic and content type distributions over time.
-
For Distribution Monitoring, they:
-
Developed a comprehensive monitoring framework tracking 15 key distribution metrics across student demographics;
- Implemented automated distribution correction when content exposure began to skew beyond established thresholds; and
-
Created visualization tools allowing educators to observe emerging recommendation patterns and manually intervene when concerning trends appeared.
-
For Intersectional Considerations, they:
-
Refined monitoring to track recommendation patterns across demographic intersections, not just individual attributes;
- Implemented customized intervention parameters for historically underserved intersectional groups; and
- Developed specialized content designed to counteract observed feedback patterns for specific intersectional groups.
Throughout implementation, they maintained a careful balance between breaking harmful feedback cycles and preserving the personalization benefits that recommendation systems provide, using targeted interventions rather than constraining the entire system.
Outcomes and Lessons
The implementation resulted in several measurable improvements over a four-month evaluation period:
- Disparity growth rates in advanced content exposure decreased by 68% across demographic groups.
- STEM content recommendation diversity increased for female students without reducing male student engagement.
- Long-term user retention improved by 13% for previously underserved demographic groups.
- Overall system performance maintained its personalization quality while achieving more equitable content distribution.
Key challenges remained, including the need for continuous monitoring as new content and users entered the system, and the ongoing tension between exploration (for fairness) and exploitation (for engagement) in the recommendation strategy.
The most generalizable lessons included:
- The importance of explicitly measuring disparity growth rates rather than just static fairness metrics, as systems can appear fair in snapshot analysis while creating significant disparities through dynamic operation.
- The effectiveness of targeted interventions for specific feedback mechanisms rather than generic fairness constraints, allowing preservation of system benefits while preventing harmful cycles.
- The critical value of intersectional analysis in feedback detection, as the most severe amplification effects often occur at demographic intersections rather than across primary demographic categories.
These insights directly informed the development of the Bias Source Identification Tool, particularly in creating methodologies for identifying and addressing dynamic bias sources that emerge through system operation over time.
5. Frequently Asked Questions
FAQ 1: Balancing Personalization and Feedback Mitigation
Q: How can we prevent harmful feedback loops in recommendation systems without sacrificing the personalization benefits that make these systems valuable to users?
A: The key lies in implementing targeted interventions rather than constraining the entire recommendation process. Start by identifying which specific feedback mechanisms create harmful amplification—not all feedback is problematic. Then implement strategic interventions like controlled exploration parameters that ensure minimum diversity while still allowing personalization within those bounds. Alternatively, implement "budget-based" approaches where the system maintains freedom to personalize recommendations as long as certain distribution constraints are satisfied across user groups. Rather than viewing feedback mitigation and personalization as opposing goals, seek intervention designs that specifically target harmful dynamics while preserving personalization benefits. Many technical approaches including multi-objective optimization, constrained reinforcement learning, and exploration-exploitation balancing can achieve this balance when properly configured for your specific application context.
FAQ 2: Detecting Feedback Without Longitudinal Data
Q: How can we identify potential feedback concerns when developing a new AI system without extensive longitudinal data showing how the system will operate over time?
A: While longitudinal data provides the most direct evidence of feedback effects, several approaches can identify potential concerns earlier: First, implement simulation testing that models how system outputs might influence future inputs based on reasonable assumptions about user and environment behavior. Second, analyze similar existing systems or predecessor versions to identify feedback patterns that might transfer to your new system. Third, conduct focused A/B tests specifically designed to detect feedback sensitivity—deploy variants with deliberately different initial conditions and measure how quickly they diverge. Fourth, implement progressive rollout with intensive monitoring of early feedback indicators like distribution stability and disparity growth rates even with limited data points. Finally, conduct proactive causal analysis to map all pathways through which system outputs might influence future inputs, then implement targeted monitoring of high-risk paths. While these approaches cannot perfectly predict feedback effects, they enable early risk assessment and mitigation design before deployment.
6. Summary and Next Steps
Key Takeaways
Feedback loops represent critical mechanisms through which initially small biases can transform into significant fairness problems over time. The key concepts from this Unit include:
- Runaway feedback effects create self-reinforcing cycles where a system's outputs influence future inputs in ways that progressively amplify existing patterns, potentially disconnecting predictions from ground truth.
- Different feedback types (direct, indirect, user-driven, system-driven) operate through distinct mechanisms and require tailored detection and intervention approaches.
- Specialized measurement techniques including disparity growth rate analysis, counterfactual simulation, and distribution shift monitoring are essential for detecting feedback-induced bias amplification.
- Targeted intervention strategies such as strategic randomization, distribution alignment, and causal intervention can break harmful feedback cycles while preserving system functionality.
These concepts directly address our guiding questions by explaining how feedback loops transform initial biases into larger disparities and by providing concrete technical approaches for detecting and interrupting these harmful cycles.
Application Guidance
To apply these concepts in your practical work:
- Implement dynamic fairness monitoring that tracks metrics over time rather than just at single points.
- Map potential feedback paths in your systems to identify high-risk areas for targeted monitoring.
- Design intervention mechanisms that automatically trigger when disparity growth exceeds acceptable thresholds.
- Validate intervention effectiveness through counterfactual testing rather than assuming static improvements will persist.
For organizations new to feedback analysis, start by focusing on the most direct feedback paths in high-risk applications, then progressively expand to more complex feedback mechanisms as capabilities mature.
Looking Ahead
In the next Unit, we will build on this foundation by examining system interaction and deployment biases—the ways that AI systems create fairness issues through their operation in real-world contexts and interaction with users. You will learn how design choices, interface elements, and operational contexts influence fairness outcomes, and how to identify these deployment-specific bias sources.
The feedback dynamics we have examined here directly inform these deployment considerations, as many system interaction biases emerge through complex feedback mechanisms between users and AI systems. Understanding both feedback loops and deployment contexts is essential for developing comprehensive bias source mapping that addresses the full lifecycle of AI systems from development through deployment and ongoing operation.
References
D'Amour, A., Srinivasan, H., Atwood, J., Baljekar, P., Sculley, D., & Halpern, Y. (2020). Fairness is not static: Deeper understanding of long term fairness via simulation studies. In Proceedings of the 2020 Conference on Fairness, Accountability, and Transparency (pp. 525-534). https://dl.acm.org/doi/10.1145/3351095.3372878
Ekstrand, M. D., Tian, M., Azpiazu, I. M., Ekstrand, J. D., Anuyah, O., McNeill, D., & Pera, M. S. (2018). All the cool kids, how do they fit in?: Popularity and demographic biases in recommender evaluation and effectiveness. In Proceedings of the 1st Conference on Fairness, Accountability and Transparency (pp. 172-186). https://proceedings.mlr.press/v81/ekstrand18b.html
Ensign, D., Friedler, S. A., Neville, S., Scheidegger, C., & Venkatasubramanian, S. (2018). Runaway feedback loops in predictive policing. In Proceedings of the 1st Conference on Fairness, Accountability and Transparency (pp. 160-171). https://proceedings.mlr.press/v81/ensign18a.html
Hashimoto, T. B., Srivastava, M., Namkoong, H., & Liang, P. (2018). Fairness without demographics in repeated loss minimization. In Proceedings of the 35th International Conference on Machine Learning (pp. 1929-1938). https://proceedings.mlr.press/v80/hashimoto18a.html
Mansoury, M., Abdollahpouri, H., Pechenizkiy, M., Mobasher, B., & Burke, R. (2020). Feedback loop and bias amplification in recommender systems. In Proceedings of the 29th ACM International Conference on Information & Knowledge Management (pp. 2145-2148). https://dl.acm.org/doi/10.1145/3340531.3412152
O'Neil, C. (2016). Weapons of math destruction: How big data increases inequality and threatens democracy. Crown Publishing Group.
Suresh, H., & Guttag, J. V. (2021). A framework for understanding sources of harm throughout the machine learning life cycle. In Equity and Access in Algorithms, Mechanisms, and Optimization (pp. 1-9). https://dl.acm.org/doi/10.1145/3465416.3483305
Yang, K., Qinami, K., Fei-Fei, L., Deng, J., & Russakovsky, O. (2020). Towards fairer datasets: Filtering and balancing the distribution of the people subtree in the ImageNet hierarchy. In Proceedings of the 2020 Conference on Fairness, Accountability, and Transparency (pp. 547-558). https://dl.acm.org/doi/10.1145/3351095.3375709
Unit 4
Unit 4: System Interaction and Deployment Biases
1. Conceptual Foundation and Relevance
Guiding Questions
- Question 1: How do human-AI interactions and deployment contexts transform theoretical fairness properties into actual fairness outcomes in operational systems?
- Question 2: What systematic approaches can practitioners implement to identify, monitor, and mitigate biases that emerge during system deployment and user interaction?
Conceptual Context
When AI systems move from development environments to real-world deployment, they encounter complex sociotechnical contexts that can fundamentally transform their fairness properties. While previous Units examined biases in data collection, feature representation, and algorithmic design, this Unit focuses on how deployment contexts and human-AI interactions create new fairness challenges that cannot be addressed through pre-deployment interventions alone.
This focus on deployment contexts is essential because fairness is not merely a static property embedded in algorithms but an emergent characteristic that manifests through dynamic interactions between technical systems, human users, and institutional environments. As Selbst et al. (2019) argue in their influential work on "abstraction traps," fairness efforts that focus exclusively on algorithmic properties while abstracting away deployment contexts often fail to achieve their intended objectives in practice (Selbst et al., 2019).
This Unit builds directly on the foundations established in previous Units by examining how biases identified in data collection, representation, and algorithm design manifest and potentially transform during deployment. It provides essential insights for the Bias Source Identification Tool we will develop in Unit 5, particularly in identifying how deployment contexts and interaction patterns create bias entry points beyond the traditional ML pipeline.
2. Key Concepts
Human-AI Interaction Biases
Human-AI interaction biases emerge from the dynamic relationship between AI systems and their human users, where user behaviors and system responses influence each other in ways that can create or amplify unfairness. This concept is fundamental to AI fairness because even technically "fair" systems can produce unfair outcomes when deployed in real-world contexts with complex human interactions.
Human-AI interaction connects to other bias types through feedback loops: user behaviors influence system responses, which in turn shape subsequent user behaviors. These interactions can amplify biases present in data or algorithms or introduce entirely new biases not observable in pre-deployment testing.
Research by Buccinca et al. (2021) demonstrates how human interpretation of AI recommendations varies systematically across demographic groups, creating disparate outcomes even when the underlying recommendations have similar accuracy. Their experiments showed that participants from historically marginalized groups were both more likely to distrust accurate AI recommendations and more likely to accept inaccurate ones compared to participants from dominant groups, reflecting different historical experiences with technological systems (Buccinca et al., 2021).
For example, in an automated hiring system, qualified candidates from different demographic backgrounds might interact differently with the interface based on their technological familiarity or trust in automated systems. These differential interaction patterns could create disparate outcomes even if the underlying algorithm treats all applicants identically.
For the Bias Source Identification Tool we will develop, understanding human-AI interaction biases will help identify how post-deployment user behaviors create fairness challenges that pre-deployment testing cannot capture. This analysis enables the development of monitoring systems that track interaction patterns across demographic groups and detect emerging disparities before they create significant harms.
Interface and Accessibility Biases
Interface and accessibility biases arise when system design choices—including visual layouts, language use, interaction modalities, and documentation—create barriers that disproportionately impact certain demographic groups. These biases are crucial for AI fairness because they determine who can effectively access and use AI systems, directly influencing who benefits from their capabilities.
This concept connects to data collection biases through selection effects: when interfaces are less accessible to certain groups, those groups become underrepresented in user data, creating a feedback loop that further diminishes system performance for these populations. Similarly, inaccessible interfaces can obscure algorithmic biases by preventing affected groups from identifying and reporting unfair outcomes.
Johnson, Anand, and Fox (2022) documented how voice-based AI assistants consistently exhibited lower accuracy rates for non-native English speakers, speakers with regional accents, and individuals with speech impediments. Their research found that these accessibility disparities stemmed not just from training data imbalances but also from interface design choices that provided insufficient feedback and correction options—problems that particularly impacted users who already experienced recognition difficulties (Johnson, Anand, & Fox, 2022).
These issues extend beyond voice interfaces to all interaction modalities. For instance, complex text-based interfaces may disadvantage users with lower literacy levels or cognitive disabilities, while visual interfaces without proper screen reader support exclude individuals with visual impairments. These accessibility barriers can create systematic patterns of exclusion that disproportionately impact already marginalized groups.
For our Bias Source Identification Tool, analyzing interface and accessibility biases will help identify how design choices can create or amplify fairness disparities during deployment. This analysis will guide the development of inclusive design practices that ensure AI systems remain accessible across diverse user populations.
Infrastructure and Resource Disparities
Infrastructure and resource disparities refer to systematic differences in technological infrastructure, computational resources, and technical expertise that create uneven access to AI systems across populations and geographic regions. This concept is essential for AI fairness because even technically unbiased systems can produce unfair outcomes when deployment infrastructures ensure that benefits flow primarily to already-advantaged communities.
These disparities interact with data collection biases by determining which communities generate sufficient data to influence system behavior, creating a feedback loop where data-poor communities become increasingly marginalized. Similarly, infrastructure limitations can amplify algorithm biases by preventing certain communities from accessing alternative services when automated systems fail them.
Work by Sambasivan et al. (2021) on "Model Cascades" demonstrates how infrastructure disparities create cascading failures in AI deployments across low-resource environments. Their research in India documented how limited connectivity, device constraints, and infrastructure gaps transformed moderate performance disparities in benchmarking environments into complete system failures for marginalized communities in real deployments (Sambasivan et al., 2021).
These effects extend globally. For example, facial recognition systems may work perfectly in well-lit environments with high-resolution cameras but fail completely in areas with inconsistent electricity or where users access services through low-end devices. Similarly, language models may perform well for languages with robust digital infrastructures while remaining inaccessible to communities with limited connectivity, creating a "digital language divide" that reinforces existing inequities.
For the Bias Source Identification Tool, understanding infrastructure and resource disparities will help identify how deployment contexts transform theoretical fairness properties into actual fairness outcomes. This analysis enables the development of deployment strategies that account for infrastructure constraints rather than assuming ideal conditions.
Organizational Implementation Contexts
Organizational implementation contexts—including institutional priorities, workflows, incentive structures, and decision processes—fundamentally shape how AI systems function in practice and who bears the costs and benefits of automation. This concept is crucial for AI fairness because the same technical system can produce radically different fairness outcomes depending on how organizations implement it within their operations.
These organizational contexts connect to algorithm biases by determining how predictions translate into decisions. For example, the same risk assessment algorithm can have drastically different fairness implications depending on how organizations use its outputs—whether they serve as one factor among many in human decisions or as automated cutoffs that directly determine outcomes.
Research by Madaio et al. (2020) demonstrates how organizational factors critically influence fairness outcomes in deployed AI systems. Their study of fairness tool adoption across organizations revealed that technical interventions frequently failed not due to algorithmic limitations but because of misalignments with existing workflows, incentive structures, and organizational priorities (Madaio et al., 2020).
For instance, an automated resume screening system might produce similar prediction distributions across demographic groups, but organizational factors—such as how recruiters interpret confidence scores, which candidates receive additional human review, or how automation integrates with existing hiring workflows—can transform these distributions into significantly different hiring outcomes.
For our Bias Source Identification Tool, analyzing organizational implementation contexts will help identify how institutional factors create or mitigate fairness disparities beyond the technical system itself. This analysis will guide the development of implementation practices that align technical capabilities with organizational processes to promote fairness throughout deployment.
Domain Modeling Perspective
From a domain modeling perspective, system interaction and deployment biases map to specific components of sociotechnical AI systems:
- User Interface Layer: How system interfaces influence the accessibility and usability of AI capabilities across different user groups.
- Deployment Infrastructure: How technical resources and constraints shape system performance in different operational environments.
- Organizational Workflows: How institutional processes integrate AI outputs into human decision-making and operational procedures.
- Monitoring Systems: How post-deployment data collection and performance tracking capture or miss emerging fairness disparities.
- Feedback Mechanisms: How user experiences and outcomes flow back into system improvements or reinforcement of existing biases.
This domain mapping helps you understand how deployment contexts and human interactions influence fairness outcomes beyond the technical system itself. The Bias Source Identification Tool will incorporate this mapping to help practitioners identify fairness considerations that extend throughout the sociotechnical deployment environment rather than stopping at algorithmic outputs.

Conceptual Clarification
To clarify these abstract concepts, consider the following analogies:
- Human-AI interaction biases function like a musical performance where both the musician and instrument adapt to each other. Just as a musician might compensate for an instrument's quirks while the instrument responds differently to various playing techniques, users and AI systems constantly adjust to each other's behaviors. This dynamic relationship means the same AI "instrument" can produce dramatically different "performances" depending on who is "playing" it and how, creating disparities that are impossible to predict by examining either the instrument or musician in isolation.
- Infrastructure and resource disparities resemble irrigation systems distributing water across different agricultural regions. Even if the water source (the AI system) contains no contaminants (biases), fields with robust irrigation infrastructure receive adequate water while those with damaged or limited infrastructure receive only a trickle—or none at all. Over time, this uneven distribution creates highly fertile regions alongside drought-stricken areas, a disparity stemming not from water quality but from infrastructure differences. Similarly, AI benefits flow primarily to communities with robust technological infrastructure, creating digital divides that mirror and reinforce existing resource inequalities.
- Organizational implementation contexts can be understood through the analogy of transplanting a tree. The same tree (AI system) can thrive or wither depending on the soil conditions, climate, and care practices in its new environment. An organization's policies, workflows, and incentive structures create the "soil" that determines whether fairness considerations flourish or fade after deployment. Even a carefully cultivated "fairness tree" will struggle in organizational "soil" lacking the nutrients of accountability, transparency, and diverse perspectives.
Intersectionality Consideration
System interaction and deployment biases present unique challenges for intersectional fairness, where multiple aspects of identity create distinct patterns of advantage and disadvantage that cannot be understood by examining single attributes in isolation. Deployment contexts can amplify these intersectional effects in several ways:
First, differential access patterns often intensify at demographic intersections. Ogbonnaya-Ogburu et al. (2020) demonstrated how Black women face distinct barriers in technological interactions that differ qualitatively from those experienced by either Black men or white women. Their research showed that voice assistants, for example, performed particularly poorly for women with non-standard accents, creating intersectional accessibility barriers that single-axis analyses would miss (Ogbonnaya-Ogburu et al., 2020).
Second, trust disparities and interaction patterns show complex intersectional variations. Individuals at specific demographic intersections may have distinct historical experiences with technological and institutional systems that shape their interaction behaviors in ways that cannot be predicted from examining individual identity dimensions separately.
Finally, organizational contexts often create unique challenges for individuals at specific intersections. For instance, automated performance evaluation systems might work adequately for both women and people of color as aggregate groups while still failing for women of color who face distinct patterns of stereotyping and evaluation not captured in single-attribute analyses.
For the Bias Source Identification Tool, addressing intersectionality in deployment contexts requires:
- Monitoring system performance across demographic intersections rather than only aggregate groups;
- Designing interfaces and deployment strategies that account for the specific needs of intersectional populations; and
- Analyzing organizational implementation patterns for potentially disparate impacts on individuals at demographic intersections.
By explicitly incorporating these intersectional considerations, the framework will help identify subtle deployment biases that might otherwise remain undetected.
3. Practical Considerations
Implementation Framework
To systematically identify and address system interaction and deployment biases, implement the following structured methodology:
-
Deployment Context Analysis:
-
Document the technological infrastructure available across different deployment environments.
- Analyze resource disparities that might create performance variations across communities.
- Assess organizational workflows and decision processes that will incorporate system outputs.
-
Map potential gaps between development environments and actual deployment contexts.
-
Interaction Pattern Monitoring:
-
Implement logging systems that track user interaction patterns across demographic groups.
- Analyze differences in system usage, navigation paths, and feature utilization.
- Monitor trust indicators such as override rates, second opinions, or abandonment patterns.
-
Establish baselines and thresholds for acceptable variation in interaction metrics.
-
Accessibility Evaluation:
-
Conduct systematic audits of interface accessibility across different user capabilities.
- Test system performance across device types, connection speeds, and technical environments.
- Evaluate documentation clarity and support resources for diverse user populations.
-
Implement regular accessibility testing with users from underrepresented groups.
-
Organizational Integration Assessment:
-
Analyze how system outputs integrate into organizational decision processes.
- Document override policies, exception handling, and escalation procedures.
- Evaluate incentive structures that might encourage or discourage fair system use.
- Assess accountability mechanisms for addressing identified fairness issues.
These methodologies integrate with standard ML operations workflows by extending deployment monitoring beyond technical performance to explicitly incorporate fairness considerations. While adding complexity to deployment processes, they help identify critical fairness issues that pre-deployment testing cannot capture.
Implementation Challenges
When implementing these approaches, practitioners commonly encounter the following challenges:
-
Limited Post-Deployment Data Collection: Many organizations lack systematic monitoring of how systems function across different user groups and contexts. Address this by:
-
Implementing privacy-preserving logging systems that capture key interaction metrics;
- Developing proxy measures when direct demographic data are unavailable; and
-
Creating sampling approaches to collect detailed interaction data from representative user subsets.
-
Cross-Functional Coordination Barriers: Addressing deployment biases requires collaboration across technical, operational, and policy teams. Address this by:
-
Establishing clear roles and responsibilities for monitoring fairness in deployed systems;
- Creating cross-functional committees with representation from technical, operational, and compliance perspectives; and
- Developing shared metrics and reporting mechanisms that communicate fairness concerns across organizational boundaries.
Successfully implementing deployment bias monitoring requires resources beyond standard ML operations, including expanded logging infrastructure, cross-functional coordination mechanisms, and potentially specialized expertise in areas like accessibility testing or organizational analysis. However, these investments help prevent costly fairness failures that might otherwise emerge only after significant harm has occurred.
Evaluation Approach
To assess whether your deployment bias monitoring is effective, implement these evaluation strategies:
-
Deployment Disparity Tracking:
-
Calculate performance disparities across different deployment environments and user groups.
- Set thresholds for acceptable variation based on domain-specific fairness requirements.
-
Implement trend analysis to identify emerging disparities before they create significant harm.
-
Interaction Equity Metrics:
-
Develop metrics for interaction equity that capture whether different user groups can effectively utilize system capabilities.
- Track override rates, completion times, and error recovery patterns across demographic groups.
-
Establish baselines that account for legitimate variation while flagging potential fairness concerns.
-
Organizational Impact Assessment:
-
Evaluate how system implementation affects decision outcomes across different populations.
- Compare automated and human decision patterns to identify potential amplification effects.
- Document organizational responses to identified fairness concerns and their effectiveness.
These metrics should be integrated with your organization's broader fairness assessment framework, providing crucial post-deployment insights that complement pre-deployment fairness evaluations.
4. Case Study: Public Benefits Eligibility System
Scenario Context
A government agency is implementing an AI-based system to streamline eligibility determinations for public benefits programs, including food assistance, healthcare subsidies, and housing support. The system analyzes application information to predict eligibility, flag potential verification issues, and recommend benefit levels. Key stakeholders include program administrators seeking efficiency, applicants from diverse backgrounds with varying needs, caseworkers transitioning to new workflows, and oversight bodies monitoring program integrity and equity.
Fairness is particularly critical in this context because the system directly impacts access to essential resources for vulnerable populations. Deployment biases could create new barriers for those already struggling with economic insecurity, potentially undermining the programs' fundamental mission of providing support to those in need.
Problem Analysis
Applying core concepts from this Unit reveals several potential deployment biases in the benefits eligibility system:
- Human-AI Interaction Biases: Analysis of early pilot deployments shows systematic differences in how applicants from different backgrounds interact with the system. Elderly applicants and those with limited English proficiency frequently abandon online applications midway through the process, reverting to paper applications that take longer to process. Additionally, applicants from historically marginalized communities show higher rates of accepting automated eligibility determinations without appeal, even when the system produces questionable results, reflecting different levels of institutional trust and perceived agency.
- Interface and Accessibility Barriers: The system interface, while compliant with basic accessibility guidelines, presents several practical barriers. The online application requires broadband internet access and functions poorly on mobile devices, which disproportionately impacts rural and low-income applicants. Documentation is primarily available in English and Spanish, excluding speakers of other languages common in certain communities. Additionally, the authentication process relies on credit history verification, creating barriers for unbanked or underbanked populations.
- Infrastructure and Resource Disparities: Deployment across different geographic regions reveals significant infrastructure challenges. Rural areas with limited internet connectivity show substantially lower online application completion rates. Community support organizations in underresourced areas lack the technical capacity to assist applicants effectively, creating regional disparities in access that mirror existing resource inequalities. Additionally, the system performs poorly on older devices commonly used in low-income communities.
- Organizational Implementation Contexts: The transition to the new system involves significant changes to caseworker workflows and decision processes. Analysis shows that different regional offices implement the system differently—some using it as a decision aid while others follow automated recommendations with minimal review. These inconsistent implementation patterns create regional variations in approval rates and verification requirements that disproportionately impact certain demographic groups. Furthermore, performance metrics focusing on processing speed incentivize caseworkers to minimize manual reviews, potentially reducing attention to complex cases.
From an intersectional perspective, the system creates particular challenges for rural elderly applicants and non-English-speaking applicants with limited digital literacy, who face multiple overlapping barriers that create near-complete exclusion from the streamlined process.
Solution Implementation
To address these identified deployment biases, the agency implemented a structured approach:
-
For Human-AI Interaction Biases, they:
-
Developed an interaction monitoring system that tracked completion rates, time spent on different sections, and abandonment patterns across demographic groups;
- Implemented proactive support interventions when the system detected confusion or abandonment risk patterns; and
-
Created a simplified appeal process with clear explanations of determination factors and applicant rights.
-
For Interface and Accessibility Barriers, they:
-
Redesigned the interface for mobile responsiveness, recognizing that over 60% of low-income applicants primarily access the internet via smartphones;
- Expanded language support to include the ten most common languages in the service area, with a clear process for requesting additional language assistance; and
-
Implemented alternative authentication methods that didn't rely exclusively on credit history or formal identification.
-
For Infrastructure and Resource Disparities, they:
-
Established community access points with reliable internet connections and compatible devices in areas with connectivity challenges;
- Provided technical training and support resources to community organizations serving marginalized populations; and
-
Developed an offline application mode that could function with intermittent connectivity, automatically synchronizing when connection was restored.
-
For Organizational Implementation Contexts, they:
-
Created standardized implementation guidelines that ensured consistent system use across regional offices;
- Revised performance metrics to include both efficiency and equity measures, preventing optimization for speed alone; and
- Implemented mandatory review processes for certain case types where automated systems historically showed limitation.
Throughout implementation, they maintained explicit focus on intersectional effects, ensuring that their interventions addressed the specific challenges faced by applicants at the intersection of multiple marginalized identities.
Outcomes and Lessons
The implementation resulted in significant improvements across multiple dimensions:
- Application completion rates increased by 45% for elderly applicants and 62% for applicants with limited English proficiency.
- Geographic disparities in successful application rates decreased by 37%, while maintaining overall program integrity.
- Appeal rates became more consistent across demographic groups, suggesting more equitable initial determinations.
Key challenges remained, including ongoing device compatibility issues and the need for continuous monitoring as community demographics evolved.
The most generalizable lessons included:
- The critical importance of monitoring interaction patterns post-deployment, which revealed fairness issues that pre-deployment testing had completely missed.
- The value of flexible implementation approaches that could adapt to different infrastructure environments rather than assuming uniform deployment contexts.
- The necessity of aligning organizational metrics and incentives with fairness goals rather than focusing exclusively on efficiency.
These insights directly inform the development of the Bias Source Identification Tool, particularly in creating monitoring approaches that track fairness across the full deployment lifecycle rather than focusing exclusively on pre-deployment testing.
5. Frequently Asked Questions
FAQ 1: Balancing Innovation With Deployment Monitoring
Q: How can we implement robust deployment bias monitoring without creating excessive delays in product innovation cycles or placing unreasonable burdens on development teams?
A: Integrate deployment monitoring incrementally, starting with high-risk touchpoints where fairness disparities would create the most significant harm. Begin with lightweight monitoring that tracks a few key metrics across the most salient demographic dimensions, then expand as expertise and infrastructure develop. Automate data collection and analysis where possible to reduce manual effort, and develop standardized dashboards that make monitoring results immediately actionable. Most importantly, frame deployment monitoring as an essential quality practice that enhances product value rather than just a compliance burden. Just as security monitoring has become integrated into standard development practices rather than treated as an afterthought, fairness monitoring should become a normal part of responsible deployment processes that actually accelerates innovation by identifying issues before they create costly failures.
FAQ 2: Addressing Deployment Biases With Limited Control
Q: What approaches can practitioners implement when they identify deployment biases but have limited control over infrastructure environments or organizational implementation contexts?
A: Start by documenting identified deployment biases with specific metrics and examples, creating visibility for issues that might otherwise remain unacknowledged. Develop clear estimates of their impact on system performance and fairness across different user groups. Next, create tiered recommendations that include both ideal interventions and pragmatic mitigations within existing constraints. For infrastructure limitations, design graceful degradation approaches that maintain core functionality in resource-constrained environments. For organizational factors, identify minimal workflow adjustments that could significantly improve fairness outcomes even without comprehensive change. Finally, build coalitions with stakeholders who share fairness concerns, including user advocates, compliance teams, and reputation-conscious leadership. Framing fairness improvements as risk mitigation rather than optional enhancements often increases organizational receptivity, particularly in regulated domains where biased outcomes could create legal or reputational risks.
6. Summary and Next Steps
Key Takeaways
System interaction and deployment biases emerge when AI systems move from development environments to real-world contexts, creating fairness challenges that pre-deployment testing cannot identify. The key concepts from this Unit include:
- Human-AI interaction biases that emerge from the dynamic relationship between systems and users, where different interaction patterns across demographic groups can create disparate outcomes even with technically "fair" algorithms.
- Interface and accessibility barriers that determine which users can effectively access AI capabilities, potentially creating systematic exclusion of already marginalized populations.
- Infrastructure and resource disparities that transform moderate performance differences into complete functionality gaps for underresourced communities, reinforcing existing digital divides.
- Organizational implementation contexts that determine how system outputs translate into actual decisions, potentially creating fairness disparities through workflow integration, incentive structures, and institutional priorities.
These concepts directly address our guiding questions by explaining how deployment contexts transform theoretical fairness properties into actual outcomes and by providing systematic approaches to identify, monitor, and mitigate biases that emerge during system operation.
Application Guidance
To apply these concepts in your practical work:
- Implement monitoring systems that track performance and interaction patterns across different user groups and deployment environments.
- Design interfaces and deployment strategies that account for infrastructure variations and accessibility needs rather than assuming ideal conditions.
- Assess how organizational workflows and decision processes interact with system outputs to create actual outcomes for different populations.
- Establish feedback mechanisms that capture emerging fairness issues during operation rather than waiting for major disparities to become evident.
For organizations new to these considerations, start by identifying the highest-risk touchpoints where deployment biases would create the most significant harm, then progressively expand monitoring as experience and capabilities develop.
Looking Ahead
In the next Unit (Unit 5), we will synthesize insights from all previous Units to develop a comprehensive Bias Source Identification Tool. This framework will provide a structured approach for identifying potential bias sources throughout the AI lifecycle—from data collection through deployment and monitoring.
The deployment biases we have examined here will form a critical component of this framework, extending bias analysis beyond the traditional ML pipeline to include the full sociotechnical system. By understanding how biases manifest and transform throughout the entire system lifecycle, you will be able to implement more effective and comprehensive fairness strategies that address root causes rather than just symptoms.
References
Buccinca, R., Varshney, M., Doroudi, S., & Zimmerman, J. (2021). Proxy tasks and subjective measures can be misleading in evaluating explainable AI systems. In Proceedings of the 2021 CHI Conference on Human Factors in Computing Systems. https://doi.org/10.1145/3411764.3445717
Johnson, K. T., Anand, S., & Fox, B. (2022). The hidden biases of voice interfaces: Disparate accuracy and effort across demographic groups. International Journal of Human-Computer Studies, 166, 102848. https://doi.org/10.1016/j.ijhcs.2022.102848
Madaio, M. A., Stark, L., Wortman Vaughan, J., & Wallach, H. (2020). Co-designing checklists to understand organizational challenges and opportunities around fairness in AI. In Proceedings of the 2020 CHI Conference on Human Factors in Computing Systems (pp. 1-14). https://doi.org/10.1145/3313831.3376445
Ogbonnaya-Ogburu, I. F., Smith, A. D., To, A., & Toyama, K. (2020). Critical race theory for HCI. In Proceedings of the 2020 CHI Conference on Human Factors in Computing Systems (pp. 1-16). https://doi.org/10.1145/3313831.3376392
Sambasivan, N., Kapania, S., Highfill, H., Akrong, D., Paritosh, P., & Aroyo, L. M. (2021). "Everyone wants to do the model work, not the data work": Data cascades in high-stakes AI. In Proceedings of the 2021 CHI Conference on Human Factors in Computing Systems (pp. 1-15). https://doi.org/10.1145/3411764.3445518
Selbst, A. D., Boyd, D., Friedler, S. A., Venkatasubramanian, S., & Vertesi, J. (2019). Fairness and abstraction in sociotechnical systems. In Proceedings of the Conference on Fairness, Accountability, and Transparency (pp. 59-68). https://doi.org/10.1145/3287560.3287598
Veale, M., Van Kleek, M., & Binns, R. (2018). Fairness and accountability design needs for algorithmic support in high-stakes public sector decision-making. In Proceedings of the 2018 CHI Conference on Human Factors in Computing Systems (pp. 1-14). https://doi.org/10.1145/3173574.3174014
Wachter, S., Mittelstadt, B., & Russell, C. (2021). Why fairness cannot be automated: Bridging the gap between EU non-discrimination law and AI. Computer Law & Security Review, 41, 105567. https://doi.org/10.1016/j.clsr.2021.105567
Yang, Q., Steinfeld, A., Rosé, C., & Zimmerman, J. (2020). Re-examining whether, why, and how human-AI interaction is uniquely difficult to design. In Proceedings of the 2020 CHI Conference on Human Factors in Computing Systems (pp. 1-13). https://doi.org/10.1145/3313831.3376301
Unit 5
Unit 5: Bias Source Identification Tool
1. Introduction
In Part 3, you learned about various types and sources of bias in AI systems, from data collection through deployment. You examined how biases enter at different stages of the ML lifecycle and how they can propagate through feedback loops. Now it's time to apply these insights by developing a practical tool that helps identify potential bias sources in AI systems. The Bias Source Identification Tool you'll create will serve as the third component of the Sprint 1 Project - Fairness Audit Playbook, ensuring that fairness assessments address all relevant bias entry points.
2. Context
Imagine you are a staff engineer at a tech company that uses AI systems across multiple products. You've been approached by the engineering team developing an AI-powered internal loan application system again. While analyzing the system that they are developing using the Historical Context Assessment Tool and Fairness Definition Selection Tool, they've identified relevant historical patterns and selected appropriate fairness definitions. Now they want to understand where biases might be entering their system and how to prioritize their mitigation efforts.
After discussions with the team, you've agreed to develop a tool that will help them systematically map potential bias entry points throughout their ML pipeline. You'll also prepare a short case study demonstrating how to use your tool for their loan application system.
You've realized that their challenge once again represents a broader opportunity: developing a tool that all teams can use to systematically identify potential bias sources in their AI applications. You've named it the "Bias Source Identification Tool."
3. Objectives
By completing this project component, you will practice:
- Translating theoretical bias taxonomies into practical identification methodologies for technical audiences.
- Creating structured approaches for prioritizing identified bias sources.
- Balancing comprehensive analysis with practical usability in business environments.
4. Requirements
Your Bias Source Identification Tool must include:
- A taxonomic classification of bias types with indicators and examples for each category.
- A bias detection methodology specifying analytical techniques for each bias type.
- A prioritization framework for focusing assessment resources on highest-risk bias sources.
- User documentation that guides users on how to apply the Bias Source Identification Tool in practice.
- A case study demonstrating the tool's application to an internal loan application system.
5. Sample Solution
The following solution was developed by a former colleague and can serve as an example for your own work. Note that this solution wasn't specifically designed for AI applications and lacks some key components that your tool should include.
5.1 Framework Overview
The Bias Source Identification Tool consists of three integrated components:
- Bias Type Taxonomy: Categorizes different types of bias.
- Detection Methodology: Provides techniques to identify each bias type.
- Prioritization Framework: Guides teams in deciding which issues to address first.
5.2 Bias Type Taxonomy
Historical Bias
- Definition: Bias resulting from pre-existing social inequities, regardless of sampling or feature selection.
- Indicators:
- Target variables reflecting historical discrimination.
- Problematic correlations that mirror societal inequities.
- Patterns that align with known historical discrimination.
- Example: A hiring algorithm trained on historical hiring decisions may perpetuate patterns of gender discrimination in technical roles.
Representation Bias
- Definition: Bias arising from how populations are sampled and measured in training data.
- Indicators:
- Demographic imbalances compared to target population
- Quality disparities across demographic groups
- Systematic measurement differences
- Example: A medical diagnostic system trained primarily on data from young adult males may perform poorly for elderly female patients.
Measurement Bias
- Definition: Bias arising from how attributes are measured, proxied, or operationalized.
- Indicators:
- Different measurement approaches across groups
- Proxy variables with varying accuracy across populations
- Inconsistent label quality across demographics
- Example: Using standardized test scores as a proxy for aptitude may disadvantage groups with less access to test preparation resources.
Aggregation Bias
- Definition: Bias arising from combining distinct populations that may have different relationships between features and outcomes.
- Indicators:
- One-size-fits-all models for heterogeneous populations
- Features with different predictive relationships across groups
- Unexplained performance disparities across subgroups
- Example: A credit scoring model might not account for different cultural approaches to credit usage, creating disparities across ethnic groups.
Learning Bias
- Definition: Bias arising from modeling choices that amplify or create disparities.
- Indicators:
- Algorithms that overfit majority patterns
- Regularization approaches that penalize minority patterns
- Optimization objectives misaligned with fairness goals
- Example: A complex model might learn spurious correlations between protected attributes and outcomes that don't represent causal relationships.
Evaluation Bias
- Definition: Bias arising from testing procedures that don't represent real-world performance or fairness.
- Indicators:
- Test datasets with different characteristics than deployment contexts
- Metrics that don't capture relevant fairness dimensions
- Insufficient disaggregation of performance across groups
- Example: Evaluating a facial recognition system on a test set that doesn't include diverse skin tones will mask potential performance disparities in deployment.
Deployment Bias
- Definition: Bias arising from how systems are implemented and used in practice.
- Indicators:
- Context shifts between training and deployment
- User interactions that reinforce biases
- Feedback loops that amplify initial disparities
- Example: A recommendation system might create filter bubbles that limit exposure diversity based on initial demographic patterns.
5.3 Detection Methodology
Detecting Historical Bias
- Using Historical Context Assessment Tool:
- Extract documented discrimination patterns from the Historical Context Assessment results.
- Identify specific historical mechanisms relevant to your application domain.
- Reference the historical pattern risk classification to prioritize investigation.
- Quantitative Techniques:
- Compare outcome distributions across groups identified as high-risk in the Historical Context Assessment.
- Analyze correlations between system predictions and historical patterns documented in the assessment.
- Test whether current data distributions match historically documented disparities.
Detecting Representation Bias
- Using Historical Context Assessment Tool:
- Reference demographic groups identified as historically underrepresented in your domain.
- Use historical documentation to establish appropriate population benchmarks.
- Identify measurement approaches that have historically varied across groups.
- Quantitative Techniques:
- Compare dataset demographics to population benchmarks established from historical context.
- Analyze missing data patterns for correlation with protected attributes.
- Assess data quality metrics across demographic groups identified in the historical assessment.
Detecting Measurement Bias
- Using Fairness Definition Selection Tool:
- Reference the selected fairness definitions to identify which measurement biases are most relevant.
- For individual fairness definitions, focus on detecting inconsistent proxies across similar individuals.
- For group fairness definitions, prioritize detecting systematic measurement differences across groups.
- Quantitative Techniques:
- Test proxy variables for differential accuracy across groups based on your selected fairness criteria.
- Analyze feature distributions to detect encoding schemes that create disparities.
- Measure label consistency across annotators for different demographic groups.
Detecting Learning Bias
- Using Fairness Definition Selection Tool:
- Analyze model behavior specifically for violations of your selected fairness definitions.
- For equal opportunity definitions, focus on false negative rate disparities.
- For demographic parity definitions, examine overall prediction rate differences.
- Quantitative Techniques:
- Measure model performance across groups according to your selected fairness metrics.
- Test regularization effects on minority group performance.
- Analyze model behavior against fairness constraints documented in your definition selection.
Detection Integration Process
- Begin by consulting the Historical Context Assessment results to identify highest-risk bias patterns.
- Reference your selected fairness definitions to determine which bias types most directly threaten your fairness goals.
- Prioritize detection efforts on bias types that both align with historical patterns and directly impact your chosen fairness definitions.
- Document each identified bias source with explicit references to both historical context and fairness definition connections.
5.4 Prioritization Framework
Assessment Dimensions
- Severity: Potential harm if the bias source remains unaddressed (1-5 scale).
- Scope: Proportion of decisions or individuals affected (1-5 scale).
- Persistence: Whether effects compound over time through feedback loops (1-5 scale).
- Intervention Feasibility: Relative ease of addressing the bias source (1-5 scale).
- Historical Alignment: Connection to historical patterns identified in Part 1 (1-5 scale).
Priority Calculation
Priority Score = (Severity × 0.3) + (Scope × 0.2) + (Persistence × 0.2) + (Historical Alignment × 0.2) + (Intervention Feasibility × 0.1)
Priority Categories
- High Priority: Score ≥ 4.0
- Medium Priority: 3.0 ≤ Score < 4.0
- Low Priority: Score < 3.0
6. Case Study: Internal Hiring System
This case study demonstrates how to apply the Bias Source Identification Tool to an AI-powered resume screening system that automatically evaluates job applications and recommends candidates for interviews.
6.1 System Context
The HR department is implementing an AI system to screen resumes for software engineering positions. The system analyzes resumes, extracts relevant information, and ranks candidates based on predicted job performance. Previous Historical Context Assessment identified patterns of gender and age discrimination in tech hiring, and the Fairness Definition Selection process prioritized equal opportunity (equal true positive rates across groups).
6.2 Step 1: System Review
The team reviewed the key components of the resume screening system:
- Data Sources: Historical resumes and performance data from past 5 years
- Feature Extraction: Text analysis of resume content, experience calculation, education assessment
- Prediction Task: Binary classification of candidates as "recommend" or "do not recommend"
- Target Variable: Based on historical performance ratings of hired employees
- Decision Threshold: Single cutoff score for all candidates
6.3 Step 2: Bias Source Identification
After applying the detection methodologies, the team identified six potential bias sources:
-
Historical Bias in Performance Ratings
-
Type: Historical Bias
- Description: Performance review data used to define "high performers" reflects historical gender disparities
-
Evidence: Statistical analysis shows 15% lower ratings for women with equivalent qualifications
-
Representation Imbalance in Training Data
-
Type: Representation Bias
- Description: Training data has significant gender and age imbalances
-
Evidence: Women constitute only 15% of the training data; candidates over 40 represent 8%
-
Educational Institution as Proxy Variable
-
Type: Measurement Bias
- Description: University prestige serves as a proxy for socioeconomic status
-
Evidence: Correlation analysis shows 0.72 correlation between institution ranking and socioeconomic indicators
-
Resume Language Pattern Differences
-
Type: Measurement Bias
- Description: Model interprets gendered language patterns differently
-
Evidence: Analysis shows terms like "led" and "executed" are weighted more positively than "collaborated" and "supported"
-
Precision-Focused Optimization
-
Type: Learning Bias
- Description: Model optimization favors precision over recall
-
Evidence: False negative rates are 23% higher for women and 18% higher for candidates over 40
-
Uniform Recommendation Threshold
-
Type: Evaluation Bias
- Description: Single threshold applied across all demographic groups
- Evidence: With current threshold, recommendation rates for qualified candidates vary by 25% across gender
6.4 Step 3: Prioritization
| Bias Source | Severity (1-5) | Scope (1-5) | Persistence (1-5) | Historical Alignment (1-5) | Intervention Feasibility (1-5) | Priority Score |
|---|---|---|---|---|---|---|
| Historical Bias in Performance Ratings | 5 | 5 | 4 | 5 | 2 | 4.5 (High) |
| Representation Imbalance | 4 | 5 | 3 | 4 | 3 | 3.9 (Medium) |
| Educational Institution as Proxy | 3 | 4 | 4 | 3 | 4 | 3.5 (Medium) |
| Resume Language Pattern Differences | 4 | 3 | 4 | 4 | 4 | 3.8 (Medium) |
| Precision-Focused Optimization | 5 | 4 | 3 | 4 | 4 | 4.1 (High) |
| Uniform Recommendation Threshold | 4 | 5 | 4 | 5 | 5 | 4.5 (High) |