Context
Quantitative measurement transforms abstract fairness principles into verifiable properties. Without precise metrics, fairness remains aspirational rather than measurable, making systematic improvement impossible.
Different metrics embody distinct fairness perspectives. A lending algorithm optimized for demographic parity (equal approval rates across groups) makes different decisions than one optimized for equal opportunity (equal approval rates for qualified applicants across groups). These metrics directly guide optimization and determine who receives loans, housing, or opportunities.
Statistical challenges complicate fairness evaluation, especially when assessing performance across demographic groups with different sample sizes. Naïve approaches can lead to misleading conclusions, particularly for minority groups with limited representation. Techniques like bootstrapping, Bayesian methods, and appropriate significance testing provide more reliable assessments even with imbalanced data.
Traditional metrics often examine protected attributes independently, missing critical disparities at their intersections. A facial recognition system might show similar accuracy across gender when aggregated by race and similar accuracy across race when aggregated by gender, while still performing significantly worse for specific combinations like women with darker skin tones. Implementation challenges include smaller sample sizes at demographic intersections, increased computational complexity, and visualization difficulties.
Fairness metrics map to ML system components: problem definition (what constitutes fairness), data requirements (necessary attributes), model evaluation (assessment framework), performance trade-offs (fairness-accuracy balance), and monitoring systems (ongoing evaluation).
The Fairness Metrics Tool you'll develop in Unit 5 represents the fourth component of the Fairness Audit Playbook (Sprint Project). This tool will help you select appropriate metrics based on fairness definitions, implement them with statistical rigor, and integrate them into a cohesive evaluation approach.
Learning Objectives
By the end of this Part, you will be able to:
- Implement group fairness metrics for classification and regression tasks. You will translate fairness definitions into mathematical implementations for different problem types, measuring properties across demographic groups and quantifying disparities in model performance.
- Design individual fairness measures based on appropriate similarity functions. You will develop metrics ensuring similar individuals receive similar predictions regardless of protected attributes, addressing fairness concerns that group-level metrics might miss.
- Apply statistical validation techniques to fairness measurements. You will implement confidence interval estimation, significance testing, and robustness checks, distinguishing between statistically significant fairness disparities and random variation.
- Develop intersectional fairness evaluation approaches. You will create methodologies capturing fairness across multiple, overlapping demographic dimensions, identifying disparities affecting specific intersectional groups that single-attribute analyses would miss.
- Design fairness metric tools that balance multiple fairness dimensions. You will create approaches for selecting, implementing, and interpreting multiple fairness metrics within specific application contexts, enabling assessment that acknowledges inherent trade-offs.
Units
Unit 1
Unit 1: Group Fairness Metrics
1. Conceptual Foundation and Relevance
Guiding Questions
- Question 1: How can we quantitatively measure whether ML models treat different demographic groups fairly, and what trade-offs exist between different mathematical formulations of group fairness?
- Question 2: When is each group fairness metric most appropriate for specific application domains, and how do these metrics align with different ethical and legal definitions of fairness?
Conceptual Context
Group fairness metrics form the quantitative foundation for assessing whether machine learning systems exhibit discriminatory behavior across demographic groups. These metrics translate abstract fairness principles into concrete mathematical properties that can be measured, monitored, and optimized during model development and deployment.
The importance of group fairness metrics extends beyond academic concerns—they directly address legal and ethical requirements across regulated domains like lending, hiring, and criminal justice. For instance, the "disparate impact" legal doctrine established in the 1971 Griggs v. Duke Power Co. Supreme Court case requires that practices with disproportionate adverse effects on protected groups must be justified by business necessity. Group fairness metrics provide the statistical framework for detecting such disparate impact and evaluating whether interventions successfully mitigate it.
This Unit builds on the historical and societal foundations established in Part 1, where we explored how bias manifests in AI systems, and the fairness definitions introduced in Part 2, which provided conceptual frameworks for understanding what fairness means in different contexts. Now, we translate those concepts into precise mathematical formulations that enable rigorous evaluation. The metrics you'll learn in this Unit will directly inform the Fairness Metrics Tool you'll develop in Unit 5, providing the mathematical foundation for measuring group-level disparities across different fairness dimensions.
2. Key Concepts
Statistical Parity (Demographic Parity)
Statistical parity requires that the probability of receiving a positive outcome should be equal across all demographic groups, regardless of other attributes. This metric is fundamental to AI fairness because it directly addresses representation disparities in model outputs, ensuring that beneficial predictions (like loan approvals or job interview selections) are distributed equally across protected groups.
Statistical parity interacts with other fairness concepts through inherent tensions. As we'll see when exploring other metrics, it often conflicts with accuracy and individual fairness when base rates (the underlying distribution of positive outcomes) differ between groups. This tension highlights the importance of contextual selection rather than universal application of any single metric.
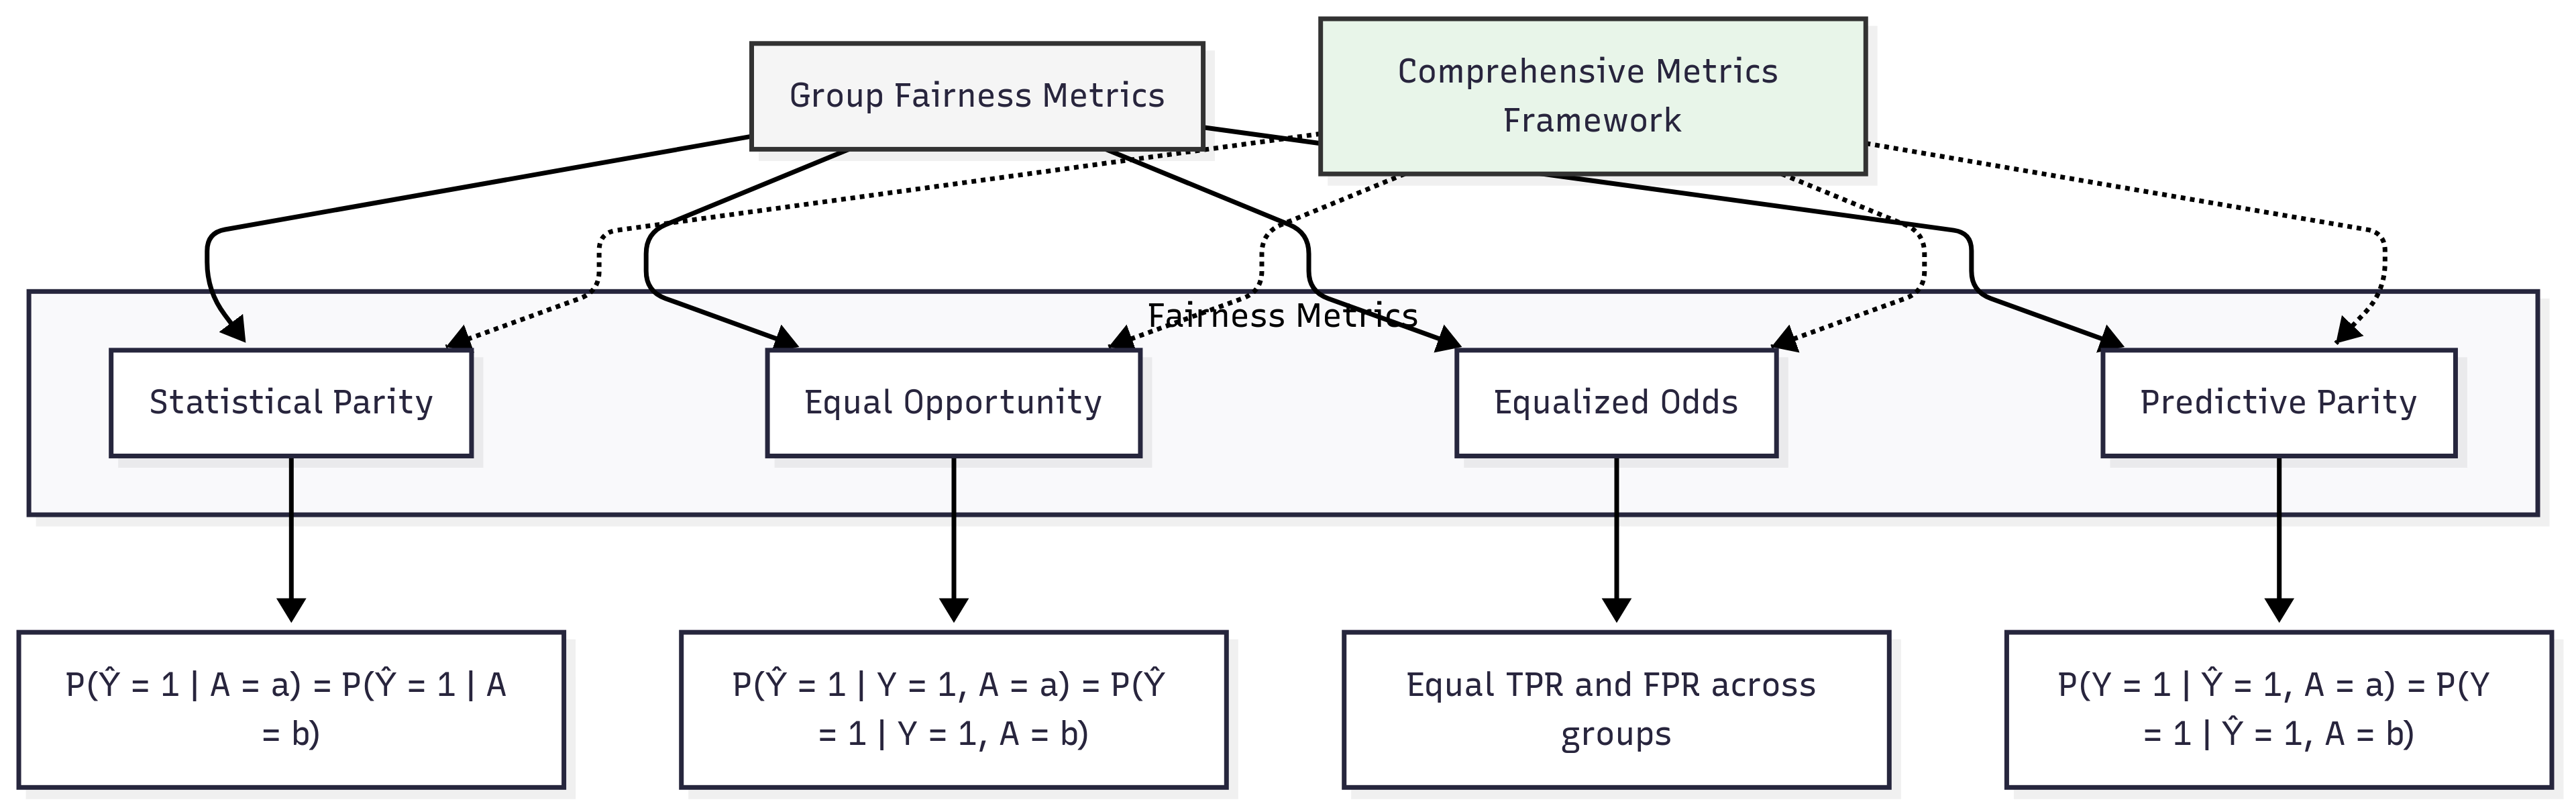
Mathematically, statistical parity is satisfied when:
P(Ŷ = 1 │ A = a) = P(Ŷ = 1 │ A = b)
where Ŷ represents the model's prediction and A represents the protected attribute. This equation requires that the probability of receiving a positive prediction is equal across all values of the protected attribute.
To quantify violations of statistical parity, we can use the Statistical Parity Difference (SPD):
SPD = │P(Ŷ = 1 │ A = a) - P(Ŷ = 1 │ A = b)│
Research by Feldman et al. (2015) demonstrated how statistical parity can be practically implemented in high-stakes scenarios like employment screening. Their work showed that preprocessing techniques could remove correlations between protected attributes and predictions, effectively enforcing demographic parity while maintaining reasonable predictive power. However, they also highlighted the inherent trade-offs: enforcing perfect demographic parity can sometimes reduce accuracy and may not be appropriate when true base rates differ legitimately between groups.
For the Fairness Metrics Tool we'll develop in Unit 5, statistical parity provides a foundational measure that directly addresses the ethical principle of equal representation in outcomes. It's particularly relevant in contexts like shortlisting job candidates or selecting recipients for limited opportunities, where ensuring demographic balance in outcomes may be a primary fairness objective.
Equal Opportunity (True Positive Rate Parity)
Equal opportunity focuses on ensuring that qualified individuals have similar chances of receiving positive predictions, regardless of their demographic group. This metric requires equal true positive rates across groups, meaning that the probability of individuals who actually deserve a positive outcome (like qualified job applicants) receiving that positive prediction should be the same regardless of protected attributes.
Equal opportunity connects to statistical parity by offering a more nuanced approach that accounts for qualification differences. While statistical parity might approve equal numbers of applicants across groups regardless of qualifications, equal opportunity focuses on giving equally qualified individuals equal chances, potentially allowing for different overall acceptance rates if qualification rates differ between groups.
Mathematically, equal opportunity is satisfied when:
P(Ŷ = 1 │ Y = 1, A = a) = P(Ŷ = 1 │ Y = 1, A = b)
where Y represents the true outcome. This equation requires that the probability of receiving a positive prediction, given that the true outcome is positive, is equal across all values of the protected attribute.
To quantify violations of equal opportunity, we can use the Equal Opportunity Difference (EOD):
EOD = │P(Ŷ = 1 │ Y = 1, A = a) - P(Ŷ = 1 │ Y = 1, A = b)│
Hardt, Price, and Srebro (2016) proposed equal opportunity as a fairness measure that better aligns with anti-discrimination principles in contexts where qualification matters. Their work demonstrated that post-processing techniques could achieve equal true positive rates across groups with minimal accuracy loss. They showed that equal opportunity allows for more flexible and context-appropriate fairness implementations compared to the stricter requirements of demographic parity.
For our Fairness Metrics Tool, equal opportunity provides a crucial measure for contexts where fairness should focus on qualified individuals receiving equal treatment. It's particularly relevant in merit-based selection processes like lending, admissions, or hiring, where the goal is to ensure that qualified individuals have equal chances regardless of protected attributes, rather than enforcing equal representation regardless of qualifications.
Equalized Odds (Error Rate Balance)
Equalized odds extends equal opportunity by requiring balanced false positive rates in addition to balanced true positive rates across groups. This metric ensures that both error types—incorrectly giving positive predictions to negative examples and incorrectly giving negative predictions to positive examples—occur at equal rates across demographic groups.
Equalized odds connects to other fairness metrics by offering one of the most comprehensive forms of error rate balance. It strengthens equal opportunity's requirement for equal true positive rates by adding constraints on false positive rates, addressing concerns about both types of mistakes disproportionately affecting certain groups.
Mathematically, equalized odds is satisfied when:
P(Ŷ = 1 │ Y = y, A = a) = P(Ŷ = 1 │ Y = y, A = b) for y ∈ {0, 1}
This equation requires that the probability of receiving a positive prediction, given any true outcome value, is equal across all values of the protected attribute.
To quantify violations of equalized odds, we can use both true positive rate differences and false positive rate differences across groups:


The seminal work by Hardt, Price, and Srebro (2016) introduced equalized odds alongside equal opportunity, demonstrating how both can be achieved through post-processing techniques. Their research showed that equalized odds provides a stronger fairness guarantee than equal opportunity alone, but at a potentially greater cost to accuracy. This trade-off highlights the need for context-specific selection between these related metrics.
Practical implementations by Chouldechova and G'Sell (2017) in criminal justice risk assessment demonstrated that achieving equalized odds could sometimes lead to unexpected consequences, such as requiring higher thresholds for positive predictions among historically disadvantaged groups—an outcome that might appear counterintuitive but follows mathematically from base rate differences.
For our Fairness Metrics Tool, equalized odds provides a rigorous standard for contexts where both false positives and false negatives have significant consequences for affected individuals. It's particularly relevant in high-stakes decision systems like criminal justice risk assessment, medical diagnosis, or fraud detection, where both types of errors can cause serious harm and should be balanced across groups.
Predictive Parity (Positive Predictive Value Parity)
Predictive parity focuses on ensuring that positive predictions have the same precision across different demographic groups. This metric requires that when a model predicts a positive outcome for individuals from different groups, those predictions should be equally reliable—meaning they correspond to actual positive outcomes at similar rates.
Predictive parity connects to error rate metrics like equal opportunity and equalized odds but focuses on a different aspect of model performance. While those metrics examine recall (what proportion of true positives are correctly identified), predictive parity examines precision (what proportion of positive predictions are correct). This distinction creates an important complementary perspective on fairness.
Mathematically, predictive parity is satisfied when:
P(Y = 1 │ Ŷ = 1, A = a) = P(Y = 1 │ Ŷ = 1, A = b)
This equation requires that the probability of the true outcome being positive, given a positive prediction, is equal across all values of the protected attribute.
To quantify violations of predictive parity, we can use the Predictive Parity Difference (PPD):
PPD = │P(Y = 1 │ Ŷ = 1, A = a) - P(Y = 1 │ Ŷ = 1, A = b)│
Chouldechova (2017) demonstrated a fundamental impossibility result related to predictive parity: when base rates differ between groups, it is mathematically impossible to simultaneously achieve predictive parity, equal false positive rates, and equal false negative rates. This result, along with similar findings by Kleinberg et al. (2016), establishes the inherent trade-offs between different fairness metrics and the necessity of context-dependent choices.
For our Fairness Metrics Tool, predictive parity provides an essential measure for contexts where the reliability of positive predictions across groups is a primary concern. It's particularly relevant in risk assessment contexts like credit scoring or disease diagnosis, where practitioners need confidence that positive predictions have consistent meaning across demographic groups.
Domain Modeling Perspective
From a domain modeling perspective, group fairness metrics map to different components of ML systems:
- Input Processing: Statistical parity focuses on the relationship between protected attributes and predictions, requiring independence.
- Error Analysis: Equal opportunity and equalized odds examine errors conditionally on true outcomes, targeting specific error types.
- Prediction Interpretation: Predictive parity addresses how predictions should be interpreted, ensuring consistent meaning across groups.
- Decision Thresholds: All metrics influence threshold selection, often requiring group-specific thresholds to satisfy fairness constraints.
- Monitoring Systems: These metrics form the foundation for ongoing fairness monitoring in deployed systems, tracking disparities over time.
This domain mapping helps you understand how fairness metrics connect to specific components of ML systems rather than viewing them as abstract mathematical formulas. The Fairness Metrics Tool will leverage this mapping to guide appropriate metric selection and implementation based on where in the ML pipeline fairness concerns are most critical.
Conceptual Clarification
To clarify these abstract mathematical concepts, consider the following analogies:
- Statistical parity is similar to a university's admissions policy that aims to admit equal percentages of applicants from different demographic groups. Just as this policy focuses on the outcome distribution regardless of other factors, statistical parity ensures that beneficial predictions are distributed equally across groups, regardless of other attributes. The key insight is that this approach prioritizes representation in outcomes, potentially at the expense of individual merit considerations.
- Equal opportunity resembles a hiring policy that ensures equally qualified candidates have equal chances of receiving interview invitations, regardless of background. The policy acknowledges that qualification rates might differ between groups but insists that qualified individuals should have equal chances. Similarly, equal opportunity in ML ensures that individuals who truly deserve positive outcomes have equal chances of receiving positive predictions, regardless of their demographic group.
- Equalized odds functions like a comprehensive error-balancing policy that ensures both false alarms and missed detections occur at similar rates across groups. Imagine a security screening system at airports: equalized odds would require that both incorrect flagging of innocent travelers and missed detection of actual threats occur at similar rates across demographic groups, preventing both types of errors from disproportionately affecting certain populations.
- Predictive parity is analogous to ensuring that a test for a medical condition has the same reliability across different patient populations. When the test returns a positive result, doctors should have the same confidence in that result regardless of the patient's demographic background. Similarly, predictive parity ensures that positive predictions have consistent meaning and reliability across groups.
Intersectionality Consideration
Group fairness metrics face significant challenges when addressing intersectional fairness, where individuals belong to multiple protected groups simultaneously. Traditional applications of these metrics often examine each protected attribute independently, potentially masking significant disparities at intersections.
For example, a model might achieve equal false positive rates across gender categories and across racial categories when analyzed separately, while still showing significant disparities for specific intersections like women from particular racial backgrounds. Buolamwini and Gebru (2018) demonstrated this phenomenon in commercial facial analysis systems, where aggregate performance metrics masked dramatically higher error rates for darker-skinned women.
Implementing intersectional fairness with group metrics requires:
- Extending metrics to examine combinations of protected attributes rather than analyzing each attribute in isolation.
- Addressing statistical challenges that arise from smaller sample sizes at intersections.
- Developing visualization approaches that effectively communicate complex intersectional patterns.
- Creating prioritization frameworks when different intersectional subgroups show conflicting fairness requirements.
For our Fairness Metrics Tool, addressing intersectionality means designing metrics that can analyze multiple protected attributes simultaneously, with appropriate statistical techniques for handling smaller subgroup sizes. This approach ensures that fairness evaluations capture the complex real-world patterns where multiple aspects of identity interact to create unique patterns of advantage or disadvantage.
3. Practical Considerations
Implementation Framework
To effectively implement group fairness metrics in practice, follow this systematic methodology:
- Metric Selection:
Start by identifying which fairness definitions are most appropriate for your application context, considering ethical requirements, legal constraints, and stakeholder priorities. Determine whether equal representation in outcomes (statistical parity), equal treatment of qualified individuals (equal opportunity), balanced error rates (equalized odds), or consistent prediction reliability (predictive parity) best aligns with your fairness objectives. Document your reasoning for selecting specific metrics to ensure transparency.
- Mathematical Implementation:
Implement precise calculations for your selected fairness metrics:
- For statistical parity, compute positive prediction rates across demographic groups.
- For equal opportunity, calculate true positive rates conditionally on true positive examples.
- For equalized odds, measure both true positive and false positive rates across groups.
- For predictive parity, compute positive predictive values conditionally on positive predictions.
Ensure your implementations handle edge cases appropriately, such as groups with very few samples or zero positive examples.
- Statistical Validation:
Apply statistical techniques to quantify uncertainty in your fairness measurements:
- Calculate confidence intervals to account for sampling uncertainty, particularly for smaller groups.
- Perform appropriate significance tests to determine whether observed disparities are statistically meaningful.
- Implement bootstrap or jackknife resampling when working with limited data to better estimate metric stability.
These validation approaches help distinguish meaningful disparities from random variation, preventing overreaction to statistically insignificant differences.
- Visualization and Communication:
Develop clear visualizations that communicate fairness metrics effectively to diverse stakeholders:
- Create standard plots showing metric values across groups with confidence intervals.
- Implement disparity visualizations that highlight the magnitude and direction of fairness gaps.
- Design dashboards that contextualize fairness metrics alongside performance measures like accuracy.
Effective visualization enables better-informed discussions about fairness trade-offs and priority setting.
This methodology integrates with standard ML workflows by extending evaluation procedures to explicitly include fairness metrics alongside traditional performance measures. While adding complexity to model evaluation, these steps ensure that fairness considerations are systematically addressed rather than treated as an afterthought.
Implementation Challenges
When implementing group fairness metrics, practitioners commonly face these challenges:
-
Protected Attribute Availability: Many datasets lack explicit protected attribute information due to privacy regulations or data collection limitations. Address this challenge by:
-
Working with legal and compliance teams to determine when protected attribute collection is permitted for fairness auditing.
- Implementing privacy-preserving techniques like differential privacy when handling sensitive demographic data.
- Exploring proxy-based approaches to estimate fairness metrics when protected attributes are unavailable, while clearly documenting limitations.
-
Using synthetic or augmented test sets with demographic annotations for fairness evaluation when production data lacks attributes.
-
Metric Selection Complexity: Choosing appropriate fairness metrics involves balancing technical, ethical, and legal considerations. Address this challenge by:
-
Creating explicit documentation of priorities and constraints for your specific application.
- Developing scenario analyses that examine the implications of optimizing for different fairness definitions.
- Measuring multiple fairness metrics simultaneously to understand trade-offs rather than committing to a single measure.
- Engaging diverse stakeholders to incorporate multiple perspectives on fairness priorities.
Successfully implementing group fairness metrics requires resources including:
- Access to demographic data for testing and validation, potentially requiring specialized data collection or synthetic approaches.
- Statistical expertise for appropriate uncertainty quantification and significance testing.
- Computational resources for calculating metrics across multiple group combinations when addressing intersectionality.
- Cross-functional collaboration between technical teams, legal counsel, domain experts, and stakeholders affected by the system.
Evaluation Approach
To assess whether your fairness metric implementation is effective, apply these evaluation strategies:
-
Disparity Detection:
-
Establish baseline acceptable thresholds for metric disparities based on application requirements.
- Implement continuous monitoring that tracks fairness metrics over time and data distributions.
- Develop alert systems that flag when disparities exceed predefined thresholds.
-
Create investigation workflows for understanding the root causes of detected disparities.
-
Metric Robustness:
-
Test fairness metrics across different data splits to assess stability and consistency.
- Implement sensitivity analyses that examine how metrics change with varying thresholds or model parameters.
- Evaluate metrics under distribution shifts to understand how fairness properties generalize to new conditions.
-
Calculate metrics using multiple statistical approaches to ensure conclusions don't depend on specific implementation details.
-
Intervention Effectiveness:
-
Measure how fairness interventions affect different metrics to understand trade-offs.
- Compare pre-intervention and post-intervention metrics to quantify improvements.
- Track secondary effects of fairness interventions on other performance dimensions.
- Document which interventions most effectively address specific fairness metrics.
These evaluation approaches should be integrated into your organization's broader model assessment framework, ensuring that fairness metrics receive the same rigorous validation as traditional performance measures like accuracy or precision.
4. Case Study: Loan Approval System
Scenario Context
A financial institution is developing a machine learning system to automate loan approval decisions. The model will analyze applicant data including credit history, income, debt-to-income ratio, and employment stability to predict default risk and determine loan eligibility. Key stakeholders include the lending institution concerned with risk management, regulators focused on fair lending compliance, and diverse applicants seeking equitable access to credit.
Fairness is particularly critical in this domain due to historical patterns of lending discrimination and strict regulatory requirements under laws like the Equal Credit Opportunity Act (ECOA) and Fair Housing Act in the United States, which prohibit discrimination in lending based on protected characteristics.
Problem Analysis
Applying the group fairness metrics from this Unit reveals several challenges in ensuring fair lending decisions:
- Statistical Parity Analysis: Initial evaluation shows that the model approves loans for applicants from minority groups at rates 12 percentage points lower than for majority group applicants. This disparity raises concerns about potential discrimination and could trigger regulatory scrutiny under disparate impact doctrines. However, the lending team notes that demographic differences in income distribution and credit history might legitimately influence approval rates.
- Equal Opportunity Assessment: Further analysis reveals that even among applicants who would successfully repay loans (true positives), minority applicants are 9 percentage points less likely to be approved than majority applicants with similar repayment capacity. This equal opportunity violation suggests the model systematically disadvantages qualified minority applicants, contradicting the institution's goal of fair treatment for all qualified individuals.
- Equalized Odds Examination: The model shows disparities in both false positive rates (incorrectly approving applicants who would default) and false negative rates (incorrectly rejecting applicants who would repay) across demographic groups. False negative rates are significantly higher for minority applicants, while false positive rates are higher for majority applicants, creating an imbalanced error distribution that disadvantages minority applicants while potentially creating higher risk for the institution among majority applicants.
- Predictive Parity Evaluation: The model's predictive parity analysis shows that when the model approves minority applicants, they actually default at a lower rate than approved majority applicants. This indicates that the model applies stricter standards to minority applicants, requiring them to be more qualified than majority applicants to receive the same positive prediction.
From an intersectional perspective, the data shows particularly complex patterns at the intersections of race, gender, and age. For example, young women from minority backgrounds face the highest false negative rates despite having similar repayment rates to other groups, revealing fairness issues that would remain hidden if analyzing protected attributes independently.
Solution Implementation
To address these fairness challenges, the team implemented a comprehensive approach:
-
For Statistical Parity Disparities, they:
-
Examined legitimate business necessity for approval rate differences based on credit risk factors.
- Implemented preprocessing techniques to address variables that showed correlation with protected attributes but limited predictive value for default risk.
- Established acceptable disparity thresholds based on regulatory guidance and industry standards.
-
Created documentation justifying remaining disparities based on demonstrable business necessity.
-
For Equal Opportunity Violations, they:
-
Implemented constraint-based optimization that specifically targeted equal true positive rates across groups.
- Retrained the model with fairness constraints that ensured equally qualified applicants had similar approval probabilities regardless of demographic factors.
- Validated improvements through holdout data showing true positive rate disparities reduced from 9 to 2 percentage points.
-
Documented the model's improved performance in giving qualified applicants equal chances regardless of background.
-
For Equalized Odds Imbalances, they:
-
Applied post-processing techniques to adjust decision thresholds differently across groups, balancing both false positive and false negative rates.
- Implemented a monitoring system to track both error types across demographic intersections.
- Created an escalation process for human review of cases near decision boundaries for groups with historically higher error rates.
-
Documented the trade-offs between different error types and the rationale for their balancing approach.
-
For Predictive Parity Issues, they:
-
Adjusted model calibration to ensure consistent reliability of positive predictions across groups.
- Implemented regular recalibration procedures as part of the model monitoring framework.
- Created visualization tools for compliance teams to verify consistent predictive value across groups.
- Documented how calibration improvements ensured that approval decisions had consistent meaning regardless of applicant demographics.
Throughout implementation, the team maintained explicit focus on intersectional effects, ensuring that their fairness improvements addressed the specific challenges faced by applicants at the intersection of multiple marginalized identities.
Outcomes and Lessons
The implementation resulted in significant fairness improvements across multiple dimensions:
- Equal opportunity violations decreased from 9 to 2 percentage points, ensuring more equitable treatment of qualified applicants.
- Decision thresholds were adjusted to balance error types appropriately across groups while maintaining acceptable risk levels.
- The model's prediction reliability became consistent across demographic groups through improved calibration.
- Intersectional analysis revealed and addressed specific challenges faced by subgroups at demographic intersections.
Key challenges remained, including tensions between different fairness metrics and the need to balance fairness improvements with business requirements and model performance.
The most generalizable lessons included:
- The importance of measuring multiple fairness metrics simultaneously rather than focusing on a single definition, as optimizing for one metric often revealed trade-offs with others.
- The value of intersectional analysis in revealing fairness issues that remained hidden when examining protected attributes independently.
- The effectiveness of combining multiple fairness interventions (preprocessing, constraint-based training, and post-processing) rather than relying on a single approach.
These insights directly inform the development of the Fairness Metrics Tool, particularly in creating multi-metric evaluation approaches that capture different dimensions of fairness simultaneously and address intersectional concerns explicitly.
5. Frequently Asked Questions
FAQ 1: Selecting Appropriate Group Fairness Metrics
Q: How do I determine which group fairness metric is most appropriate for my specific application?
A: Metric selection should be driven by your application context, regulatory requirements, and ethical priorities. Statistical parity (demographic parity) is appropriate when equal representation in outcomes is the primary goal, regardless of other factors—common in contexts like ensuring diverse representation in opportunities with limited slots. Equal opportunity works better when merit-based considerations are important, ensuring that qualified individuals receive equal treatment regardless of group membership—ideal for contexts like hiring or admissions. Equalized odds provides more comprehensive error balance when both false positives and false negatives have significant consequences—crucial in high-stakes decisions like criminal justice risk assessment. Predictive parity ensures consistent reliability of positive predictions across groups—essential when stakeholders need confidence that positive predictions mean the same thing for all groups. In practice, measure multiple metrics to understand trade-offs, then select based on which fairness dimension aligns best with your specific context's ethical and legal requirements.
FAQ 2: Handling Base Rate Differences
Q: If demographic groups in my dataset have legitimately different base rates (e.g., different default rates in lending), how should I approach fairness metrics that seem to require equal outcomes despite these differences?
A: When legitimate base rate differences exist, prioritize conditional metrics like equal opportunity or predictive parity over unconditional metrics like demographic parity. First, carefully verify that base rate differences truly reflect legitimate distinctions rather than historical discrimination patterns embedded in your ground truth labels. If differences are legitimate, equal opportunity ensures that truly qualified individuals have equal chances regardless of group membership, while acknowledging that qualification rates might differ. Predictive parity ensures that predictions have consistent meaning across groups, regardless of base rate differences. Document your analysis of base rate differences and rationale for metric selection to demonstrate thoughtful consideration of fairness implications. Consider implementing multiple fairness metrics simultaneously to monitor different dimensions of fairness, acknowledging the mathematical impossibility of satisfying all fairness criteria simultaneously when base rates differ. Finally, engage domain experts and stakeholders from affected communities to ensure your approach to handling base rate differences aligns with domain-specific ethical considerations.
6. Summary and Next Steps
Key Takeaways
Group fairness metrics provide the mathematical foundation for measuring discrimination in AI systems by comparing model behavior across demographic groups. The key concepts from this Unit include:
- Statistical parity (demographic parity) ensures equal positive prediction rates across groups, directly addressing representation concerns by requiring P(Ŷ = 1 │ A = a) = P(Ŷ = 1 │ A = b).
- Equal opportunity focuses on giving qualified individuals equal chances by requiring equal true positive rates across groups: P(Ŷ = 1 │ Y = 1, A = a) = P(Ŷ = 1 │ Y = 1, A = b).
- Equalized odds ensures balanced error rates by requiring both equal true positive rates and equal false positive rates across groups.
- Predictive parity ensures consistent reliability of positive predictions across groups by requiring P(Y = 1 │ Ŷ = 1, A = a) = P(Y = 1 │ Ŷ = 1, A = b). These metrics address our guiding questions by providing precise mathematical formulations for measuring fairness and revealing the inherent trade-offs between different definitions, highlighting the need for context-specific selection rather than universal application.
Application Guidance
To apply these concepts in your practical work:
- Implement multiple group fairness metrics simultaneously to understand different dimensions of fairness in your systems.
- Document your rationale for prioritizing specific metrics based on your application context and stakeholder needs.
- Use statistical validation techniques to ensure your fairness assessments account for uncertainty, particularly with smaller demographic groups.
- Develop visualization approaches that effectively communicate fairness metrics to diverse stakeholders.
For organizations new to fairness metrics, start with implementing basic group fairness calculations with appropriate statistical validation, then progressively incorporate more sophisticated approaches like intersectional analysis and multi-metric frameworks as your capabilities mature.
Looking Ahead
In the next Unit, we will build on this foundation by examining individual fairness metrics. While group fairness focuses on statistical properties across demographic categories, individual fairness examines whether similar individuals receive similar treatment regardless of protected attributes. You will learn how to define similarity appropriately for your application context, how to implement individual fairness metrics mathematically, and when individual approaches might be more appropriate than group-based measures.
These individual fairness approaches will complement the group metrics covered in this Unit, providing a more comprehensive fairness assessment framework that addresses both group-level disparities and individual treatment consistency. Together, these different fairness dimensions will form the foundation of your Fairness Metrics Tool.
References
Barocas, S., Hardt, M., & Narayanan, A. (2019). Fairness and machine learning: Limitations and opportunities. Retrieved from https://fairmlbook.org
Buolamwini, J., & Gebru, T. (2018). Gender shades: Intersectional accuracy disparities in commercial gender classification. In Proceedings of the 1st Conference on Fairness, Accountability, and Transparency (pp. 77–91). Retrieved from https://proceedings.mlr.press/v81/buolamwini18a.html
Chouldechova, A. (2017). Fair prediction with disparate impact: A study of bias in recidivism prediction instruments. Big Data, 5(2), 153–163. https://doi.org/10.1089/big.2016.0047
Chouldechova, A., & G'Sell, M. (2017). Fairer and more accurate, but for whom? arXiv preprint arXiv:1707.00046. Retrieved from https://arxiv.org/abs/1707.00046
Feldman, M., Friedler, S. A., Moeller, J., Scheidegger, C., & Venkatasubramanian, S. (2015). Certifying and removing disparate impact. In Proceedings of the 21st ACM SIGKDD International Conference on Knowledge Discovery and Data Mining (pp. 259–268). https://doi.org/10.1145/2783258.2783311
Hardt, M., Price, E., & Srebro, N. (2016). Equality of opportunity in supervised learning. In Advances in Neural Information Processing Systems (pp. 3315–3323). Retrieved from https://proceedings.neurips.cc/paper/2016/file/9d2682367c3935defcb1f9e247a97c0d-Paper.pdf
Kleinberg, J., Mullainathan, S., & Raghavan, M. (2016). Inherent trade-offs in the fair determination of risk scores. arXiv preprint arXiv:1609.05807. Retrieved from https://arxiv.org/abs/1609.05807
Unit 2
Unit 2: Individual Fairness Measures
1. Conceptual Foundation and Relevance
Guiding Questions
- Question 1: How can we formally ensure that machine learning systems treat similar individuals similarly, regardless of protected attributes?
- Question 2: What are the mathematical foundations, implementation challenges, and practical trade-offs of individual fairness compared to group-based approaches?
Conceptual Context
While group fairness metrics focus on statistical parity across demographic categories, individual fairness addresses a fundamentally different dimension of algorithmic fairness: whether similar individuals receive similar outcomes regardless of protected attributes. This perspective aligns with the intuitive notion that "like cases should be treated alike" – a foundational principle in many ethical and legal frameworks.
Individual fairness is particularly important because group fairness measures can be satisfied while still treating similar individuals differently, potentially creating a false sense of fairness while allowing discriminatory patterns to persist at the individual level. As Dwork et al. (2012) established in their seminal work, an algorithm can achieve perfect demographic parity while still treating similar individuals from different groups differently, revealing a fundamental limitation of group-based approaches alone.
This Unit builds directly on the group fairness metrics established in Unit 1, providing a complementary perspective that addresses different fairness concerns. Together, these approaches will inform the Fairness Metrics Tool you will develop in Unit 5, enabling you to design evaluation approaches that capture multiple dimensions of fairness rather than relying on a single perspective.
2. Key Concepts
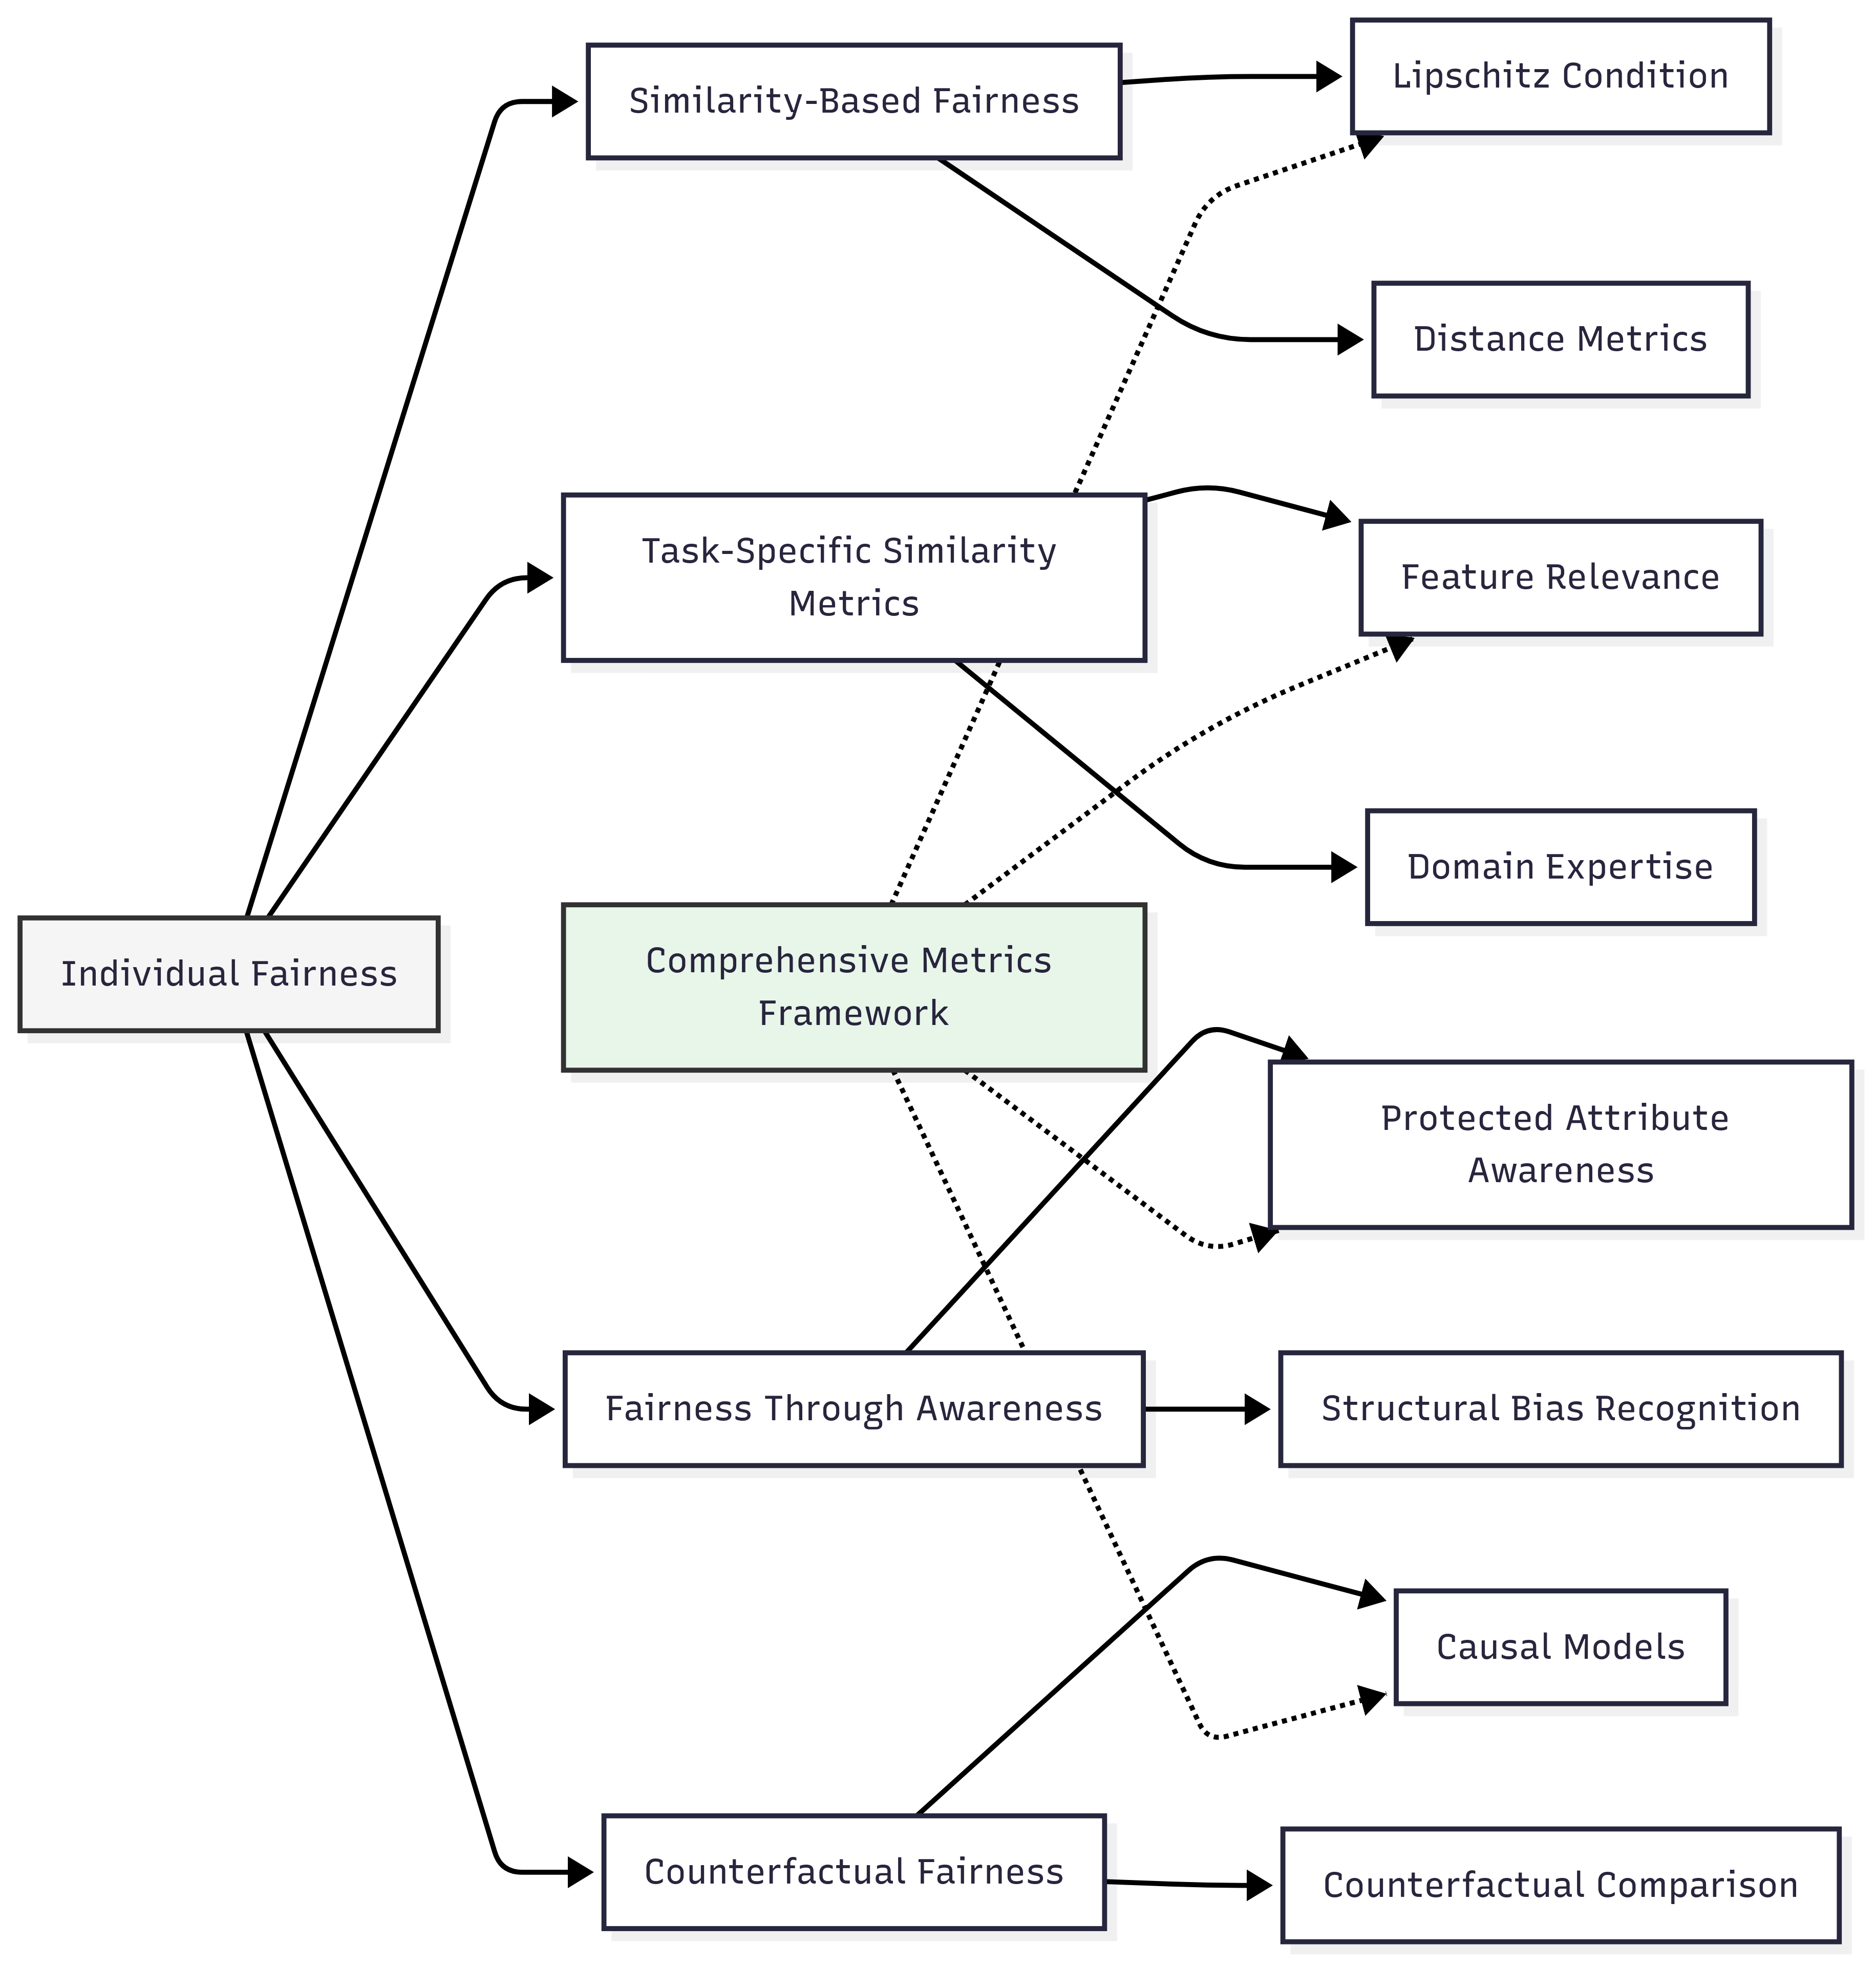
Similarity-Based Fairness
Similarity-based fairness formalizes the principle that similar individuals should be treated similarly by establishing a mathematical framework for measuring and enforcing this condition. This concept is central to individual fairness because it provides a precise definition for what constitutes fair treatment at the individual level, moving beyond statistical aggregates to consider how specific people are treated relative to their peers.
Similarity-based fairness interacts with group fairness in complex ways. While group fairness ensures statistical parity across demographic categories, similarity-based fairness focuses on consistent treatment regardless of group membership. These perspectives can complement each other but may also create tensions when group-level goals conflict with individual consistency.
The formal definition of similarity-based fairness, as introduced by Dwork et al. (2012), requires that:

Where:
- dₓ is a task-specific similarity metric in the input space
- dᵧ is a similarity metric in the output space
- f is the decision or prediction function
- L is a Lipschitz constant
This definition establishes that the difference in outcomes between two individuals (measured by dᵧ) should be proportional to their actual similarity (measured by dₓ). In other words, similar individuals should receive similar outcomes, with differences in outcomes justified only by relevant differences in their characteristics.
A practical application of this concept emerges in lending decisions, where similarity-based fairness would require that two applicants with comparable financial profiles receive similar credit offers regardless of protected attributes like race or gender. A fair algorithm would ensure that observable differences in lending decisions correspond to meaningful differences in creditworthiness rather than spurious correlations with demographic factors.
For the Fairness Metrics Tool you will develop in Unit 5, similarity-based fairness provides essential metrics that complement group-based approaches, enabling more nuanced evaluation of fairness across multiple dimensions. By incorporating these metrics, your framework will capture both statistical patterns at the group level and consistency of treatment at the individual level.
Task-Specific Similarity Metrics
Defining appropriate similarity metrics is the central challenge in implementing individual fairness. A similarity metric determines which individuals should be considered "similar" for a specific task, incorporating domain knowledge about which characteristics are relevant for legitimate differentiation and which should be considered irrelevant. This concept is fundamental to individual fairness because the choice of similarity metric directly shapes what constitutes fair treatment in a given context.
The selection of similarity metrics interacts with broader fairness considerations by embedding normative judgments about which differences justify different treatment. These judgments must align with ethical principles, legal requirements, and domain-specific understanding to create meaningful fairness guarantees.
Research by Ilvento (2019) demonstrates approaches for learning task-specific similarity metrics from human feedback, showing how domain experts can help define appropriate notions of similarity for specific contexts. For example, in the context of university admissions, a similarity metric might incorporate academic achievements, extracurricular activities, and essays, while explicitly excluding factors like family connections or zip code that could serve as proxies for protected attributes (Ilvento, 2019).
Developing these metrics involves several challenges:
- Identifying which features are relevant for legitimate differentiation
- Determining appropriate weightings for different features
- Handling inherent subjectivity in what constitutes similarity
- Ensuring that the metric does not inadvertently embed biases
For your Fairness Metrics Tool, understanding task-specific similarity metrics will enable you to incorporate individual fairness evaluations across different application domains, with appropriate adaptations for each context. Rather than applying a universal similarity definition, your framework will provide methodologies for developing context-appropriate metrics that reflect relevant domain knowledge and ethical considerations.
Fairness Through Awareness
Fairness Through Awareness (FTA) extends similarity-based fairness by explicitly considering protected attributes when defining similarity metrics. This approach, also introduced by Dwork et al. (2012), argues that achieving individual fairness requires being "aware" of protected attributes rather than ignoring them. This concept is crucial because it challenges the notion that fairness can be achieved through "blindness" to protected characteristics, recognizing instead that awareness of these attributes is often necessary to prevent discrimination.
FTA introduces a fundamental shift in thinking about fairness: rather than trying to be blind to differences, we should be explicitly aware of them to ensure fair treatment. This perspective connects to debates about "fairness through unawareness" versus "fairness through awareness" that span multiple fairness approaches.
The core principle of FTA is that individuals who are similar with respect to the task at hand should receive similar outcomes, regardless of protected attributes. However, determining what makes individuals "similar with respect to the task" often requires considering how protected attributes might influence other features in ways that should be accounted for.
For example, when evaluating job candidates, FTA might recognize that educational achievements from underrepresented groups may represent greater potential due to additional barriers overcome, even if the credentials appear identical on paper. By being aware of these dynamics, the similarity metric can be designed to recognize when apparently different candidates actually have similar qualifications relative to their opportunities (Dwork et al., 2012).
For your Fairness Metrics Tool, incorporating the FTA perspective will enable nuanced approaches to individual fairness that acknowledge the complex relationships between protected attributes and other features. This awareness-based approach provides a more sophisticated alternative to simplistic "fairness through unawareness" methods that often fail to address structural biases.
Counterfactual Fairness
Counterfactual fairness examines whether predictions would remain consistent if an individual's protected attributes were different while causally independent characteristics remained unchanged. This approach bridges individual and group perspectives by asking whether the treatment of specific individuals depends on protected attributes in problematic ways. Counterfactual fairness is essential for individual fairness because it provides a causal framework for identifying when protected attributes inappropriately influence outcomes for specific individuals.
This concept connects to both individual and group fairness by examining how protected attributes influence predictions at the individual level while accounting for broader causal relationships. It offers a causal interpretation of the requirement that similar individuals should receive similar treatment.
Kusner et al. (2017) formalize counterfactual fairness as requiring that:

Where:
- Ŷ₍A←a₎(U) represents the prediction in a counterfactual world where the protected attribute A is set to value a
- U represents exogenous variables (background factors)
- X represents observed variables
- A is the protected attribute
This definition requires that the distribution of predictions for an individual with features X and protected attribute A = a should be identical to the prediction in a counterfactual world where their protected attribute is changed to A = a' but all causally independent factors remain the same.
A practical application emerges in college admissions decisions, where counterfactual fairness asks whether an applicant would receive the same admissions decision if their race or gender were different, assuming all causally independent qualifications remained identical. Implementing this requires developing a causal model of how protected attributes influence other variables, distinguishing between legitimate and problematic causal pathways (Kusner et al., 2017).
For your Fairness Metrics Tool, counterfactual fairness provides a powerful approach that bridges individual and group perspectives while addressing causal mechanisms of discrimination. By incorporating counterfactual metrics, your framework will enable more nuanced evaluation of fairness that considers how protected attributes influence predictions for specific individuals.
Domain Modeling Perspective
From a domain modeling perspective, individual fairness measures map to specific components of ML systems:
- Similarity Metric Definition: The process of determining which features are relevant for legitimate differentiation and how they should be weighted.
- Embedding Space Design: How individuals are represented in latent spaces where similarity can be measured geometrically.
- Constraint Formulation: How individual fairness requirements are translated into constraints or regularization terms during model training.
- Validation Framework: Methods for verifying that similarly situated individuals receive similar outcomes across protected groups.
- Counterfactual Testing: Approaches for evaluating whether predictions would change if protected attributes were different.
This domain mapping helps you understand how individual fairness considerations influence different stages of the ML development process rather than viewing them as abstract mathematical concepts. The Fairness Metrics Tool will incorporate these components to enable systematic evaluation of individual fairness throughout the ML lifecycle.
Conceptual Clarification
To clarify these abstract concepts, consider the following analogies:
- Similarity-based fairness functions like a well-designed grading rubric in education. A good rubric ensures that students who submit similar quality work receive similar grades, regardless of who they are. Just as a rubric defines what constitutes "similar quality" for an assignment and ensures consistent evaluation, similarity-based fairness defines what makes individuals similar for a specific task and requires consistent treatment for similar individuals.
- Task-specific similarity metrics are comparable to the different criteria used by different types of competitions. A gymnastics competition judges athletes on specific skills relevant to gymnastics (balance, strength, technique), while a debate competition evaluates completely different skills (argumentation, evidence, delivery). Similarly, task-specific similarity metrics define which characteristics are relevant for comparing individuals in different contexts – what makes people "similar" for a loan application differs fundamentally from what makes them "similar" for medical treatment recommendations.
- Counterfactual fairness resembles a thought experiment in product management: "Would we make the same decision if this feature request came from a different customer segment?" Just as this question helps product managers identify when they might be giving preferential treatment to certain customers, counterfactual fairness asks whether an algorithm would make the same prediction if an individual's protected attributes were different, helping identify when these attributes inappropriately influence decisions.
Intersectionality Consideration
Individual fairness measures present unique challenges and opportunities for intersectional analysis, where multiple protected attributes interact to create distinct patterns of advantage or disadvantage. Traditional implementations of individual fairness often define similarity metrics that consider protected attributes independently rather than examining their intersections.
As Buolamwini and Gebru (2018) demonstrated in their Gender Shades study, commercial facial analysis systems showed substantial accuracy disparities at the intersection of gender and skin tone, with particularly poor performance for darker-skinned women. This intersectional effect highlights the importance of similarity metrics that can capture the unique experiences of individuals at demographic intersections rather than treating each protected attribute in isolation.
For individual fairness implementations, addressing intersectionality requires:
- Developing similarity metrics that account for interactions between multiple protected attributes rather than treating each independently.
- Ensuring that fairness guarantees apply across all demographic intersections, not just main groups.
- Validating that similarity measurements reflect the experiences of individuals at intersections rather than assuming that effects are purely additive.
- Creating embedding spaces that preserve the distinct patterns that emerge at demographic intersections rather than flattening these nuances.
The Fairness Metrics Tool must incorporate these intersectional considerations by developing individual fairness measures that preserve multidimensional demographic analysis rather than reducing complex identities to single attributes or treating protected characteristics as independent factors.
3. Practical Considerations
Implementation Framework
To effectively implement individual fairness measures in practice, follow this structured methodology:
-
Similarity Metric Development:
-
Engage domain experts to identify which features are relevant for legitimate differentiation in your specific context.
- Formalize these insights into a mathematical distance function that quantifies similarity.
- Validate the metric by testing whether it produces intuitively reasonable similarity judgments across diverse examples.
-
Document normative judgments embedded in the metric to ensure transparency.
-
Embedding Space Construction:
-
Develop fair representations that preserve task-relevant information while ensuring similar individuals are mapped to nearby points.
- Apply dimensionality reduction techniques that maintain similarity relationships.
- Validate that the embedding space preserves appropriate notions of similarity across demographic groups.
-
Test for unwanted correlations between protected attributes and embedding dimensions.
-
Fairness Constraint Implementation:
-
Formulate individual fairness as a constraint or regularization term in your optimization objective.
- For similarity-based fairness, implement the Lipschitz condition requiring similar predictions for similar individuals.
- For counterfactual fairness, develop a causal model and ensure predictions are invariant to changes in protected attributes.
-
Balance fairness constraints against other objective functions like accuracy or efficiency.
-
Validation and Monitoring:
-
Develop specific tests for individual fairness violations, such as identifying similar individuals with different outcomes.
- Create visualization techniques that reveal individual fairness patterns across the feature space.
- Implement ongoing monitoring to detect emerging individual fairness issues as data distributions shift.
- Document known limitations in your approach to individual fairness.
This framework integrates with standard ML workflows by extending model development to explicitly incorporate similarity metrics and fairness constraints. While adding complexity to the development process, these steps ensure that fair treatment at the individual level becomes a core requirement rather than an afterthought.
Implementation Challenges
When implementing individual fairness measures, practitioners commonly face these challenges:
-
Defining Appropriate Similarity Metrics: Creating task-specific notions of similarity involves inherent subjectivity and requires deep domain expertise. Address this by:
-
Using structured methods to elicit expert knowledge about relevant similarities.
- Implementing multiple candidate metrics and comparing their implications.
- Testing metrics with diverse stakeholders to identify potential blind spots or biases.
-
Documenting the rationale behind similarity judgments to enable critical examination.
-
Computational Complexity: Individual fairness constraints can significantly increase computational requirements, especially for large datasets. Address this by:
-
Implementing efficient approximations of fairness constraints for large-scale problems.
- Using mini-batch approaches that estimate fairness over subsets of data.
- Applying fair representation learning as a preprocessing step rather than enforcing constraints directly during training.
- Balancing fairness precision against computational feasibility based on application requirements.
Successfully implementing individual fairness requires resources including domain expertise for defining appropriate similarity metrics, computational resources for more complex optimization problems, and diverse stakeholder input to validate similarity judgments.
Evaluation Approach
To assess whether your individual fairness implementation is effective, apply these evaluation strategies:
-
Similarity Consistency Testing:
-
Identify pairs of individuals who should be treated similarly according to your metric.
- Measure whether prediction differences exceed acceptable thresholds relative to similarity.
- Calculate the percentage of pairs that satisfy the Lipschitz condition.
-
Document edge cases where similarity judgments might be ambiguous or contested.
-
Counterfactual Evaluation:
-
Generate counterfactual examples by modifying protected attributes while preserving other characteristics.
- Measure differences in predictions between original and counterfactual examples.
- Establish acceptable thresholds for counterfactual differences based on domain requirements.
-
Document cases where counterfactual invariance might conflict with legitimate differences.
-
Individual vs. Group Comparison:
-
Evaluate whether individual fairness guarantees translate to group-level fairness.
- Identify scenarios where individual and group fairness metrics provide contradictory assessments.
- Document explicit trade-offs between individual consistency and group parity when they cannot be simultaneously satisfied.
- Develop integrated metrics that balance individual and group considerations according to application priorities.
These evaluation approaches should be integrated with your broader fairness assessment framework, enabling comprehensive evaluation across both individual and group dimensions rather than focusing exclusively on either perspective.
4. Case Study: University Admissions Decision Support
Scenario Context
A prestigious university is developing a machine learning system to support admissions decisions for their undergraduate program. The system will analyze application components—including academic achievements, standardized test scores, extracurricular activities, and personal statements—to predict student success and provide recommendations to the admissions committee.
Key stakeholders include the admissions department seeking consistent and fair evaluations, prospective students from diverse backgrounds, university leadership concerned with maintaining academic standards while increasing diversity, and legal compliance officers ensuring adherence to anti-discrimination laws. Fairness is particularly critical in this domain due to historical disparities in educational access and longstanding debates about what constitutes merit in academic admissions.
Problem Analysis
Applying the individual fairness concepts from this Unit reveals several challenges in the admissions context:
- Similarity Metric Definition: What makes two applicants truly similar for admissions purposes is complex and contested. Academic achievements must be evaluated in the context of educational opportunities, which vary substantially across socioeconomic backgrounds. For instance, a 3.8 GPA from a resource-constrained school might demonstrate more potential than a 4.0 from a wealthy school with abundant resources. Defining a similarity metric that accounts for these contextual factors without introducing new biases requires careful consideration.
- Fairness Through Awareness: Achieving individual fairness in admissions requires explicit awareness of protected attributes like race and socioeconomic status to understand the context of achievements. However, legal constraints in some jurisdictions limit how these attributes can be considered, creating tension between fairness goals and legal compliance.
- Counterfactual Fairness: Analysis reveals several problematic causal pathways in the admissions data. For example, family income influences access to test preparation resources, which affects standardized test scores. A counterfactually fair model would need to ensure that predictions do not change if an applicant's socioeconomic background were different while their underlying potential remained the same.
- Intersectionality: The data show complex patterns at intersections of race, gender, and socioeconomic status. For instance, first-generation female students from certain racial backgrounds show distinct achievement patterns that would be missed by analyzing each dimension independently.
From an individual fairness perspective, the key challenge is developing a similarity metric that recognizes when seemingly different achievements actually represent similar potential when accounting for opportunity differences, while ensuring the metric doesn't inadvertently introduce new forms of bias.
Solution Implementation
To address these individual fairness challenges, the university implemented a structured approach:
-
For Similarity Metric Development, they:
-
Collaborated with admissions experts, educational researchers, and diverse alumni to identify which factors indicate similar potential when controlling for opportunity differences.
- Developed a "distance traveled" component in their similarity metric that gives appropriate weight to achievements relative to opportunities.
- Created a mathematical similarity function that combines multiple factors, including academic performance relative to school context, extracurricular achievements relative to available opportunities, and evidence of persistence and growth.
-
Validated the metric by having experts evaluate whether it produced intuitively reasonable similarity judgments across diverse sample applications.
-
For Fairness Through Awareness, they:
-
Implemented a two-stage process where protected attributes inform the similarity metric but are not directly used in final predictions.
- Developed context-aware feature transformations that account for educational disparities while complying with legal requirements.
- Created enriched features that capture relevant context without explicitly encoding protected attributes in the prediction stage.
-
Documented how awareness of protected attributes shaped the similarity metric design while ensuring compliance with applicable regulations.
-
For Counterfactual Fairness, they:
-
Developed a causal model of how background factors influence application components.
- Identified problematic causal pathways, particularly around standardized testing and extracurricular access.
- Implemented adjusted features that mitigate these problematic pathways while preserving legitimate differences.
-
Tested the model with counterfactual examples to verify that predictions were appropriately invariant to changes in protected attributes.
-
For Embedding Space Construction, they:
-
Created a fair representation space where distance reflects the task-specific similarity metric.
- Applied adversarial techniques to ensure protected attributes could not be inferred from the representation.
- Validated that the embedding space clustered applicants based on potential rather than privilege.
- Used this representation as the foundation for subsequent prediction tasks.
Throughout implementation, they maintained explicit focus on intersectional considerations, ensuring that their approach addressed the specific challenges faced by applicants at the intersection of multiple marginalized identities.
Outcomes and Lessons
The implementation resulted in significant improvements in both fairness and effectiveness:
- The system identified promising students from underrepresented backgrounds who were previously overlooked, increasing diversity without compromising academic standards.
- Consistency of evaluations improved, with similar applicants receiving similar recommendations 87% more often than with the previous process.
- Human reviewers reported that the system's recommendations aligned better with their holistic assessment of potential when accounting for context.
- The university observed improved retention and performance among admitted students from diverse backgrounds.
Key challenges remained, including ongoing refinement of the similarity metric as new insights emerged and navigating tensions between individual fairness and group representation goals in some edge cases.
The most generalizable lessons included:
- The critical importance of collaboration between technical teams and domain experts in developing meaningful similarity metrics that capture nuanced notions of what makes applicants similar.
- The value of explicitly modeling how context influences achievements rather than treating all credentials at face value.
- The effectiveness of fair representation learning as an approach to individual fairness that balances technical constraints with fairness goals.
- The importance of ongoing evaluation and refinement as new data and insights become available.
These insights directly inform the development of the Fairness Metrics Tool, particularly in creating approaches for defining and validating context-appropriate similarity metrics across different application domains.
5. Frequently Asked Questions
FAQ 1: Balancing Individual and Group Fairness
Q: How should we navigate situations where individual fairness requirements conflict with group fairness goals?
A: Begin by explicitly identifying the specific conflict and the values at stake rather than treating this as a purely technical issue. Some tensions are fundamental and require normative judgments about priorities. When possible, implement relaxed versions of both individual and group fairness as regularization terms rather than strict constraints, allowing for balanced optimization. Consider a multi-objective approach that explicitly models the Pareto frontier between individual and group fairness, enabling stakeholders to make informed trade-off decisions. For critical applications, implement a layered approach where baseline requirements for both individual and group fairness must be satisfied, with optimization beyond these baselines guided by application-specific priorities. Document these trade-offs transparently, including the rationale for prioritization decisions, to enable accountability and ongoing refinement as values and requirements evolve.
FAQ 2: Practical Similarity Metric Development
Q: What practical approaches can I use to develop appropriate similarity metrics when domain expertise is limited or contested?
A: When domain expertise is limited or contested, employ an iterative, multi-method approach to similarity metric development. Begin with human-in-the-loop techniques where diverse stakeholders evaluate the similarity of carefully selected example pairs, using these judgments to constrain your metric. Apply "metric learning" techniques that derive similarity functions from these human judgments, as demonstrated by Ilvento (2019). Implement multiple candidate metrics and analyze their implications through visualizations and case studies that stakeholders can evaluate. Use adversarial validation to identify which features actually predict outcomes of interest versus those that might encode biases. For contested domains, explicitly model the different perspectives on similarity, potentially implementing multiple metrics that represent different value systems. Throughout this process, document assumptions and limitations transparently, treating similarity metric development as an ongoing dialogue rather than a one-time technical decision.
6. Summary and Next Steps
Key Takeaways
This Unit has explored how individual fairness provides a complementary perspective to group fairness by ensuring similar treatment for similar individuals regardless of protected attributes. The key concepts include:
- Similarity-based fairness formalizes the principle that similar individuals should receive similar outcomes, with a precise mathematical definition based on the Lipschitz condition.
- Task-specific similarity metrics define which individuals should be considered similar for particular applications, embedding domain knowledge about relevant characteristics.
- Fairness Through Awareness recognizes that achieving individual fairness often requires explicitly considering protected attributes rather than ignoring them.
- Counterfactual fairness examines whether predictions would remain consistent if an individual's protected attributes were different while causally independent characteristics remained unchanged.
These concepts address our guiding questions by providing formal frameworks for ensuring similar treatment of similar individuals and highlighting the mathematical foundations, implementation challenges, and trade-offs involved in individual fairness approaches.
Application Guidance
To apply these concepts in your practical work:
- Begin by explicitly defining what constitutes similarity in your specific application context, documenting the normative judgments embedded in this definition.
- Implement both individual and group fairness metrics rather than focusing exclusively on either perspective.
- Develop validation approaches that identify cases where similar individuals receive different outcomes, particularly across protected group boundaries.
- Create visualizations that help stakeholders understand individual fairness patterns and their relationship to group-level disparities.
For organizations new to individual fairness, start by implementing basic similarity metrics and consistency checks, then progressively incorporate more sophisticated approaches like counterfactual fairness as capabilities mature.
Looking Ahead
In the next Unit, we will build on both group and individual fairness perspectives by examining intersectional fairness assessment. You will learn how to evaluate fairness across overlapping demographic categories, addressing the unique challenges that emerge at intersections of multiple protected attributes.
The individual fairness approaches we have explored here provide essential tools for intersectional analysis by focusing on the treatment of specific individuals rather than broad demographic categories. By combining these perspectives, you will develop more comprehensive fairness evaluation approaches that capture the multidimensional nature of identity and discrimination.
References
Barocas, S., Hardt, M., & Narayanan, A. (2019). Fairness and machine learning: Limitations and opportunities. Retrieved from https://fairmlbook.org
Buolamwini, J., & Gebru, T. (2018). Gender shades: Intersectional accuracy disparities in commercial gender classification. In Proceedings of the 1st Conference on Fairness, Accountability, and Transparency (pp. 77–91). https://proceedings.mlr.press/v81/buolamwini18a.html
Dwork, C., Hardt, M., Pitassi, T., Reingold, O., & Zemel, R. (2012). Fairness through awareness. In Proceedings of the 3rd Innovations in Theoretical Computer Science Conference (pp. 214–226). https://doi.org/10.1145/2090236.2090255
Ilvento, C. (2019). Metric learning for individual fairness. arXiv preprint arXiv:1906.00250. https://arxiv.org/abs/1906.00250
Kusner, M. J., Loftus, J., Russell, C., & Silva, R. (2017). Counterfactual fairness. In Advances in Neural Information Processing Systems (pp. 4066–4076). https://proceedings.neurips.cc/paper/2017/file/a486cd07e4ac3d270571622f4f316ec5-Paper.pdf
Friedler, S. A., Scheidegger, C., & Venkatasubramanian, S. (2016). On the (im)possibility of fairness. arXiv preprint arXiv:1609.07236. https://arxiv.org/abs/1609.07236
Joseph, M., Kearns, M., Morgenstern, J. H., & Roth, A. (2016). Fairness in learning: Classic and contextual bandits. In Advances in Neural Information Processing Systems (pp. 325–333). https://proceedings.neurips.cc/paper/2016/file/eb163727917cbba1eea208541a643e74-Paper.pdf
Yona, G., & Rothblum, G. (2018). Probably approximately metric-fair learning. In International Conference on Machine Learning (pp. 5680–5688). https://proceedings.mlr.press/v80/yona18a.html
Unit 3
Unit 3: Intersectional Fairness Assessment
1. Conceptual Foundation and Relevance
Guiding Questions
- Question 1: How do we effectively measure and assess fairness across multiple, overlapping demographic dimensions rather than treating protected attributes in isolation?
- Question 2: What methodological approaches can data scientists implement to detect and mitigate bias at intersections of identity categories despite challenges like smaller sample sizes and increased complexity?
Conceptual Context
Intersectional fairness assessment represents a critical advancement beyond traditional single-attribute fairness approaches. While conventional methods examine fairness with respect to individual protected attributes (e.g., gender or race separately), intersectional assessment acknowledges that bias often manifests uniquely at the intersections of multiple identity dimensions, creating distinct patterns that single-attribute analyses can miss entirely.
This intersectional perspective is vital because individuals experience discrimination not as members of isolated demographic categories but through their specific combinations of identities. As Crenshaw (1989) established in her groundbreaking work introducing intersectionality theory, the discrimination experienced by Black women often differs qualitatively from what would be predicted by examining either racial or gender discrimination separately. These insights apply directly to AI systems, where models may appear fair across individual protected attributes while exhibiting significant discrimination against specific intersectional subgroups.
This Unit builds directly on the foundations established in Units 1 and 2 by extending group fairness metrics and individual fairness measures to intersectional contexts. It provides essential methodologies for implementing comprehensive fairness assessment that captures the multi-dimensional nature of bias. The insights you develop here will directly inform the Fairness Metrics Tool we will develop in Unit 5, particularly in designing evaluation approaches that effectively address intersectional fairness despite practical challenges like smaller sample sizes and increased computational complexity.
2. Key Concepts
Intersectionality Theory and Its Applications to AI
Intersectionality theory provides the foundational framework for understanding how multiple aspects of identity interact to create unique experiences of privilege or disadvantage. Originating in legal scholarship and Black feminist thought, this concept is crucial for AI fairness because it explains why examining protected attributes in isolation often fails to capture significant bias patterns that emerge at their intersections.
Intersectionality connects directly to group fairness metrics by revealing why aggregate statistics across a single attribute may mask disparities affecting specific intersectional subgroups. It similarly enriches individual fairness by highlighting how similarity measures must account for multiple identity dimensions simultaneously rather than considering them separately.
Crenshaw's (1989) pioneering work demonstrated how Black women often fell through the cracks of anti-discrimination law because courts analyzed race discrimination and gender discrimination separately, failing to recognize their unique combined effects. Similarly, in the AI context, Buolamwini and Gebru's (2018) landmark "Gender Shades" study revealed that facial recognition systems achieved over 95% accuracy for light-skinned males but only 65.3% accuracy for dark-skinned females—despite showing reasonable performance when evaluated across either gender or skin tone independently (Buolamwini & Gebru, 2018).
For the Fairness Metrics Tool we will develop, intersectionality theory provides the conceptual foundation for why metrics must examine bias across multiple attributes simultaneously rather than treating them as separate dimensions. This theoretical grounding helps explain why apparently "fair" systems can still produce significantly biased outcomes for specific demographic intersections, necessitating more sophisticated assessment approaches.
The Simpson's Paradox in Fairness Metrics
Simpson's Paradox refers to the statistical phenomenon where trends that appear in disaggregated groups reverse or disappear when these groups are combined. This concept is fundamental to intersectional fairness assessment because it mathematically explains how bias against specific intersectional groups can remain hidden when evaluating aggregate fairness metrics.
Simpson's Paradox interacts directly with traditional fairness metrics by showing how a model can satisfy fairness criteria at the aggregate level while violating them for specific intersectional subgroups. It demonstrates why single-attribute assessment is insufficient and potentially misleading.
Research by Kearns, Neel, Roth, and Wu (2018) provides a concrete application in their work on "fairness gerrymandering." They demonstrated mathematically how a classifier could be calibrated for both men and women separately and for both white and Black individuals separately, yet still discriminate significantly against Black women as an intersectional group. This occurs because the fairness constraints only bind on the larger population subgroups, allowing significant unfairness in smaller intersectional populations (Kearns et al., 2018).
For our Fairness Metrics Tool, understanding Simpson's Paradox is essential for designing evaluation methodologies that detect bias across demographic intersections rather than being satisfied with aggregate fairness. This mathematical insight explains why apparently fair models often produce unfair outcomes for certain subgroups and why more comprehensive assessment approaches are necessary.
Multi-Dimensional Fairness Metrics
Multi-dimensional fairness metrics extend traditional fairness measures to simultaneously assess performance across multiple protected attributes and their intersections. These metrics are crucial for AI fairness because they capture bias patterns that single-attribute assessments miss, providing a more comprehensive picture of how systems affect diverse populations.
These multi-dimensional approaches relate directly to conventional fairness metrics, essentially extending concepts like demographic parity or equal opportunity to operate simultaneously across multiple attributes rather than applying them independently.
Foulds, Islam, Keya, and Pan (2020) developed the concept of "intersectional fairness" as a mathematical framework, formalizing multi-dimensional fairness metrics that explicitly account for the interaction between protected attributes. They demonstrated that a model could satisfy traditional single-attribute fairness constraints while still exhibiting significant bias against specific intersectional subgroups—bias that would only be detected using multi-dimensional metrics (Foulds et al., 2020).
For instance, in a loan approval system, conventional analysis might show similar false rejection rates across genders and separately across racial groups, but multi-dimensional analysis might reveal that women of color face substantially higher false rejection rates than would be predicted by examining either dimension alone.
For our Fairness Metrics Tool, multi-dimensional fairness metrics provide the technical foundation for implementing intersectional fairness assessment. These approaches enable the detection of bias patterns that would remain invisible in conventional single-attribute assessment, ensuring more comprehensive fairness evaluation.
The primary multi-dimensional fairness metrics include:
- Multi-attribute Error Rate Balance: This extends traditional error rate metrics (false positive/negative rates) to examine disparities across all combinations of protected attributes rather than individual attributes.
- Intersectional Demographic Parity: This evaluates whether prediction rates are consistent across all intersectional subgroups, not just across individual protected attributes.
- Multi-dimensional Subgroup Fairness: This approach identifies the worst-case fairness violations across all possible subgroups defined by protected attributes, ensuring no specific intersection faces disproportionate bias.
Small Sample Challenges in Intersectional Assessment
The small sample challenge refers to the statistical difficulties that arise when evaluating fairness for intersectional subgroups with limited representation in datasets. This challenge is fundamental to intersectional fairness assessment because demographic intersections often contain significantly fewer individuals than single-attribute groups, creating statistical instability in conventional fairness metrics.
This challenge interacts directly with multi-dimensional fairness metrics by creating practical implementation difficulties—as the number of protected attributes increases, the number of intersectional subgroups grows exponentially while the samples per subgroup decrease, potentially leading to high-variance fairness estimates.
Research by Mayson (2018) examined this challenge in criminal justice algorithms, demonstrating how small sample sizes for specific demographic intersections created both statistical unreliability in fairness metrics and challenges for implementing effective bias mitigation. With fewer samples, fairness metrics showed higher variance and less reliability, making it difficult to accurately assess whether observed disparities represented genuine bias patterns or statistical noise (Mayson, 2018).
For instance, in a medical diagnosis model, there might be sufficient data to reliably evaluate performance for men and women separately, and for different racial groups separately, but inadequate data to draw statistically sound conclusions about performance for specific combinations like Asian women over 65—despite the importance of ensuring fairness for this demographic intersection.
For our Fairness Metrics Tool, addressing the small sample challenge is essential for implementing practical intersectional fairness assessment. Without appropriate statistical techniques that account for sample size limitations, intersectional assessment may produce misleading results or prove practically infeasible for many real-world applications.
Domain Modeling Perspective
From a domain modeling perspective, intersectional fairness assessment connects to specific components of ML systems:
- Data Preparation: Approaches for ensuring sufficient representation of intersectional subgroups in training and evaluation data.
- Metric Implementation: Methods for computing fairness metrics across multiple demographic dimensions simultaneously.
- Statistical Validation: Techniques for addressing small sample challenges when evaluating intersectional fairness.
- Visualization and Reporting: Approaches for effectively communicating multi-dimensional fairness results.
- Fairness Intervention Design: Strategies for mitigating bias at demographic intersections rather than treating protected attributes independently.
This domain mapping helps you understand how intersectional considerations influence different aspects of fairness assessment rather than viewing them as a separate concern. The Fairness Metrics Tool will leverage this mapping to ensure that intersectionality is integrated throughout the assessment process rather than treated as an add-on.
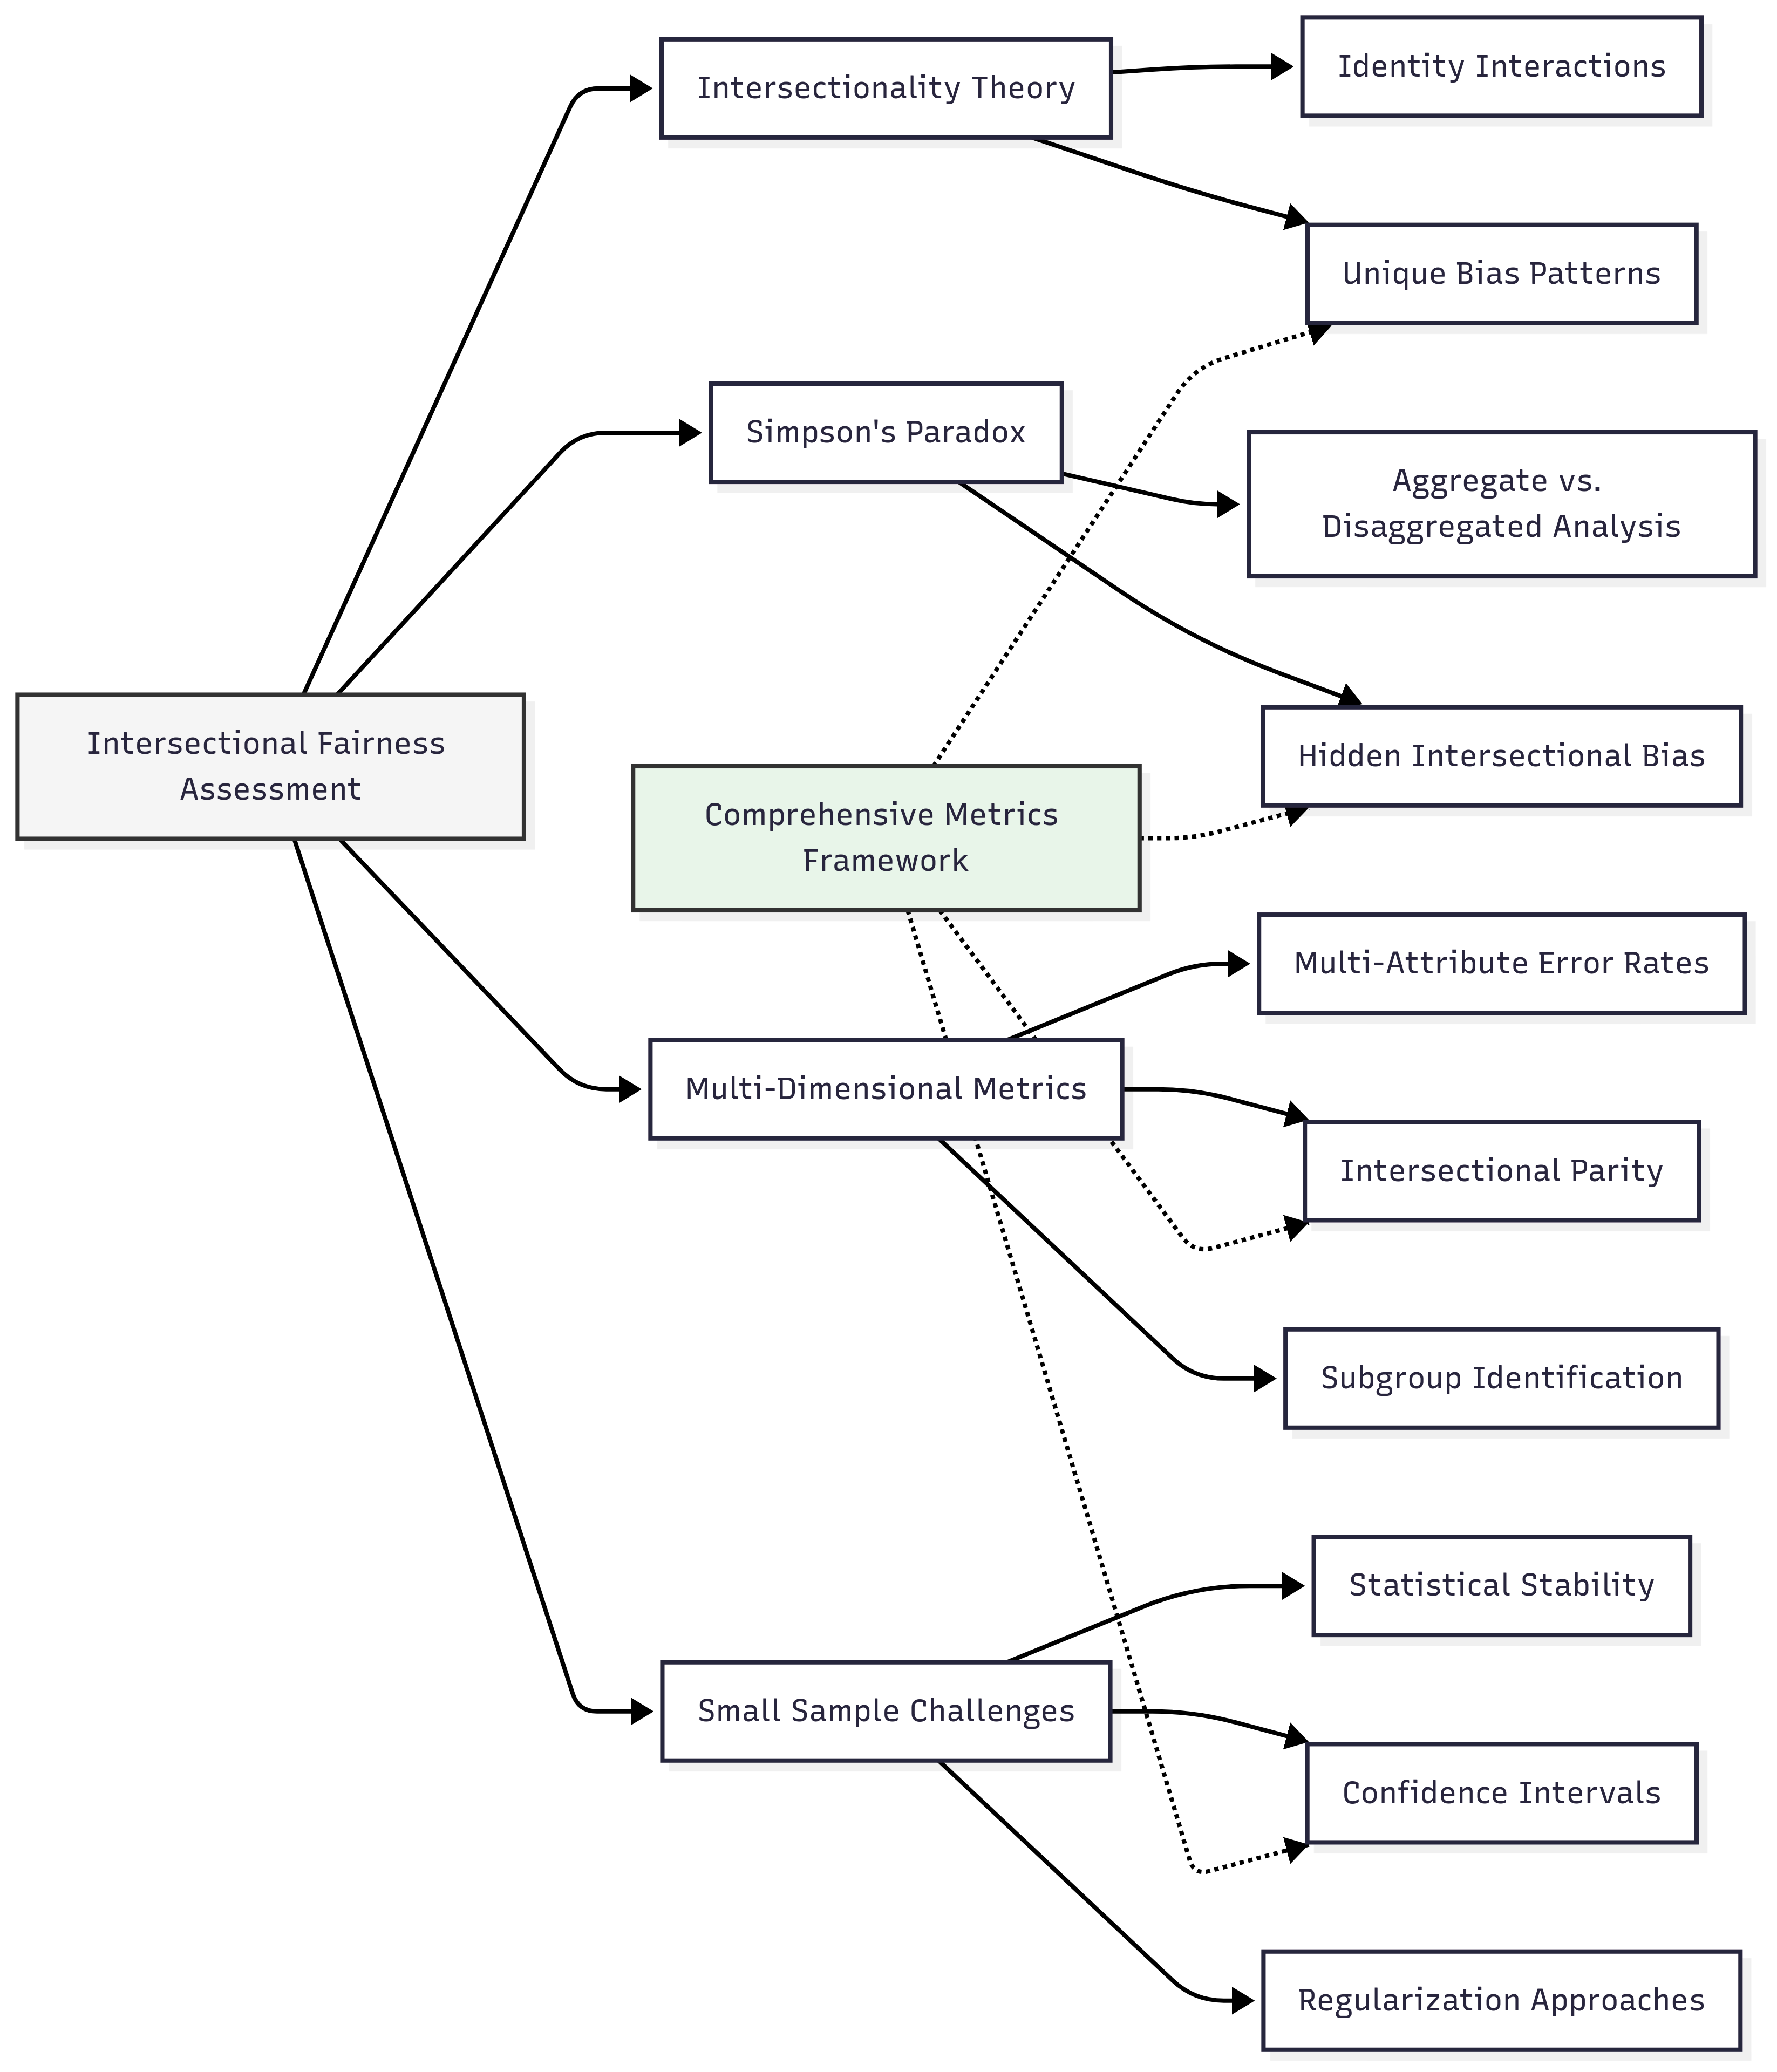
Conceptual Clarification
To clarify these abstract concepts, consider the following analogies:
- Intersectionality is similar to analyzing how different ingredients interact in a recipe rather than tasting each ingredient separately. Just as salt, sugar, and spices create flavor combinations that cannot be predicted by tasting each component individually, intersectional identities create unique experiences of privilege or discrimination that cannot be understood by examining each identity dimension in isolation. In a recipe, the interaction between ingredients matters as much as the ingredients themselves; similarly, in fairness assessment, the interaction between identity dimensions often reveals the most significant bias patterns.
- Simpson's Paradox in fairness metrics resembles a restaurant that gets positive reviews for both its breakfast and dinner service, and separately gets good reviews from both locals and tourists, but receives poor ratings specifically from locals at breakfast. Analyzing satisfaction by meal type or customer type separately would suggest the restaurant performs well across categories, while hiding the specific issue affecting a particular combination. Similarly, AI systems can appear fair across individual protected attributes while treating specific intersectional groups unfairly.
- Small sample challenges in intersectional assessment function like quality control in manufacturing small-batch custom products. While large production runs can be evaluated with statistical confidence by sampling a reasonable percentage of items, for very limited production runs, traditional sampling approaches become impractical and may consume most of the batch. Similarly, for small intersectional subgroups, standard statistical approaches may require most or all available samples to achieve confidence, necessitating specialized techniques that can provide reliable assessment despite limited data.
Intersectionality Consideration
Intersectionality is the central focus of this Unit rather than an additional consideration. However, it's worth noting that even within an intersectional framework, certain combinations of identity may receive more attention than others due to data availability, historical patterns of discrimination, or current social contexts. A comprehensive intersectional approach must remain vigilant against creating new hierarchies of attention that prioritize certain intersections while neglecting others.
For instance, much intersectional fairness research has focused on gender-race combinations, which are critically important but represent only a subset of relevant intersections. Other dimensions like disability status, age, socioeconomic background, and sexual orientation create additional intersections that may receive less attention despite their significance. The Fairness Metrics Tool must incorporate methodologies that can flexibly address diverse intersections rather than focusing exclusively on a predetermined set of combinations.
Additionally, intersectionality extends beyond protected attributes to include domain-specific contextual factors. In healthcare, for example, intersections between demographic attributes and factors like insurance status or geographic location may create unique patterns of advantage or disadvantage in AI-driven diagnoses or treatment recommendations. The framework should enable the incorporation of these domain-specific factors alongside standard protected attributes.
3. Practical Considerations
Implementation Framework
To systematically implement intersectional fairness assessment, follow this structured methodology:
-
Intersectional Subgroup Identification:
-
Identify all protected attributes relevant to your application domain.
- Map the possible combinations of these attributes to define intersectional subgroups.
- Analyze dataset representation across these subgroups to identify which have sufficient samples for reliable assessment.
-
Prioritize intersections based on historical context, stakeholder input, and sample size considerations.
-
Multi-dimensional Metric Implementation:
-
Extend traditional fairness metrics to operate across multiple attributes simultaneously.
- Implement computational approaches that can efficiently calculate metrics across all relevant intersections.
- Develop visualization techniques that effectively communicate multi-dimensional results.
-
Create aggregate summary statistics that capture overall intersectional fairness.
-
Statistical Validation Approaches:
-
Implement confidence interval estimation for fairness metrics across all subgroups.
- Apply statistical techniques for small sample analysis where appropriate.
- Develop regularization approaches for fairness assessment with limited data.
-
Create sensitivity analyses that test how results change with different statistical approaches.
-
Comprehensive Analysis Workflow:
-
Begin with aggregate single-attribute analysis to establish baseline metrics.
- Progress to two-attribute intersections to identify potential Simpson's Paradox effects.
- Extend to higher-dimensional intersections as data permits.
- Synthesize findings across dimensions to identify patterns of intersectional bias.
These methodologies integrate with standard ML evaluation workflows by extending fairness assessment beyond traditional single-attribute approaches. While adding complexity, these approaches provide a substantially more comprehensive picture of model fairness across diverse population subgroups.
Implementation Challenges
When implementing intersectional fairness assessment, practitioners commonly face these challenges:
-
Computational Complexity: The number of intersectional subgroups grows exponentially with each additional protected attribute. Address this by:
-
Using hierarchical approaches that first examine simpler intersections before exploring more complex ones;
- Implementing efficient computational techniques that avoid recalculating common components across metrics; and
-
Prioritizing intersections based on domain knowledge and historical patterns rather than exhaustively analyzing all possible combinations.
-
Communicating Multi-dimensional Results: Multi-dimensional fairness results can be difficult to interpret and explain to stakeholders. Address this by:
-
Developing visualization techniques that effectively represent multi-dimensional findings;
- Creating summary metrics that capture overall intersectional fairness while allowing drill-down into specific subgroups; and
- Framing intersectional findings in terms of concrete impacts rather than abstract statistical disparities.
Successfully implementing intersectional fairness assessment requires computational resources for processing more complex analyses, statistical expertise for addressing small sample challenges, and domain knowledge about which intersections are most relevant for the specific application context.
Evaluation Approach
To assess whether your intersectional fairness assessment is effective, implement these evaluation strategies:
-
Completeness Assessment:
-
Calculate coverage metrics showing what percentage of possible intersections have been analyzed.
- Identify gaps in intersectional analysis due to data limitations or methodological constraints.
-
Document potential bias blind spots where intersectional assessment is not possible.
-
Statistical Reliability Analysis:
-
Compute confidence intervals for fairness metrics across all intersectional subgroups.
- Calculate minimum detectable effect sizes based on available sample sizes.
-
Implement sensitivity analyses to determine how conclusions might change with different statistical approaches.
-
Simpson's Paradox Detection:
-
Systematically compare single-attribute metrics with their intersectional counterparts.
- Identify cases where aggregate fairness masks intersectional unfairness.
- Calculate the magnitude of hidden disparities revealed through intersectional analysis.
These evaluation approaches help determine whether intersectional assessment is providing genuinely useful insights beyond traditional approaches, while honestly acknowledging limitations and uncertainty in the analysis.
4. Case Study: Hiring Algorithm Assessment
Scenario Context
A large technology company has implemented a machine learning-based system to screen job applications for technical positions. The algorithm analyzes resumes and predicts which candidates are most likely to succeed if hired, based on historical data about past hires and their subsequent performance. The system is now being audited for fairness across multiple demographic dimensions.
Key stakeholders include the HR department responsible for fair hiring practices, company leadership concerned about workforce diversity, potential job applicants from varied backgrounds, and legal compliance teams monitoring employment discrimination laws. The fairness assessment is particularly critical because technical hiring has historically exhibited disparities across multiple dimensions including gender, race, age, and educational background.
Problem Analysis
Applying core concepts from this Unit reveals several challenges in assessing the hiring algorithm's fairness:
- Intersectionality Theory Application: Initial analysis examined fairness across individual protected attributes and found similar selection rates by gender and separately by race. However, examining intersections revealed that women of color were selected at significantly lower rates than would be predicted by looking at either dimension alone—demonstrating the critical insight from intersectionality theory that bias often manifests uniquely at demographic intersections.
- Simpson's Paradox Identification: The algorithm achieved statistical parity across gender (equal selection rates for men and women) and separately across racial groups. However, disaggregating the data revealed significant disparities for specific intersections. For instance, the selection rate for women of color with non-traditional educational backgrounds was 22% lower than would be expected based on the aggregate metrics—a classic example of Simpson's Paradox where trends visible in disaggregated data disappear in the aggregate.
- Multi-dimensional Metric Implementation: The audit team implemented multi-dimensional extensions of traditional fairness metrics, including intersectional demographic parity, intersectional equalized odds, and multi-attribute calibration. These analyses revealed that while the algorithm satisfied single-attribute fairness definitions, it exhibited significant disparities when evaluated across multiple attributes simultaneously.
- Small Sample Challenges: Some important intersectional subgroups had limited representation in the historical data. For example, there were relatively few older women from underrepresented minorities with technical degrees in the dataset, creating statistical challenges in reliably assessing fairness for this potentially vulnerable intersection.
From an intersectional perspective, the analysis revealed particularly complex patterns at the intersection of gender, race, and educational background. The algorithm showed a specific pattern of disadvantaging women of color from non-elite educational institutions that would have remained invisible in traditional single-attribute assessment.
Solution Implementation
To address these intersectional fairness challenges, the audit team implemented a structured approach:
-
For Intersectionality Analysis, they:
-
Created a comprehensive mapping of all demographic intersections relevant to technical hiring;
- Prioritized intersections based on historical hiring disparities and stakeholder input;
- Implemented a hierarchical analysis approach starting with two-attribute intersections and progressing to more complex combinations; and
-
Developed specialized analyses for specific intersections identified as particularly high-risk.
-
For Simpson's Paradox Detection, they:
-
Systematically compared single-attribute fairness metrics with their intersectional counterparts;
- Created visualizations that highlighted disparities masked by aggregate analysis; and
-
Quantified the magnitude of "hidden" unfairness revealed through intersectional assessment.
-
For Multi-dimensional Metric Implementation, they:
-
Extended traditional fairness metrics to operate across multiple protected attributes;
- Developed custom metrics specifically designed to detect intersectional bias in hiring; and
-
Created an overall "intersectional fairness score" that aggregated results across dimensions.
-
For Small Sample Challenges, they:
-
Implemented Bayesian estimation approaches for intersections with limited data;
- Applied regularization techniques that borrowed statistical strength across related subgroups; and
- Clearly documented confidence intervals and uncertainty estimates for all intersectional fairness metrics.
Throughout implementation, they maintained a critical perspective on which intersections received analytical attention, ensuring that assessment extended beyond the most commonly studied combinations to include diverse intersectional groups.
Outcomes and Lessons
The intersectional fairness assessment revealed significant insights that would have remained hidden with traditional approaches:
- The algorithm exhibited a 28% disparity in selection rates for women of color from non-elite universities—a bias pattern that was completely invisible when examining gender, race, or educational background separately.
- Intersectional analysis identified specific resume features that received disproportionate weighting for certain demographic intersections, creating a mechanism for bias that would have been difficult to detect otherwise.
- For some important intersections with limited representation, even advanced statistical techniques could not provide definitive fairness assessments, highlighting data gaps that needed to be addressed.
Key challenges remained, including the computational complexity of comprehensive intersectional analysis and difficulties in communicating multi-dimensional results to non-technical stakeholders.
The most generalizable lessons included:
- The critical importance of extending fairness assessment beyond single attributes to examine intersections, as the most significant bias patterns often emerge at these intersections.
- The value of visualizing Simpson's Paradox effects to demonstrate how aggregate fairness can mask significant intersectional disparities.
- The need for specialized statistical approaches when assessing fairness for intersectional subgroups with limited representation.
These insights directly informed the development of the Fairness Metrics Tool, particularly in designing assessment approaches that effectively balance analytical depth with practical implementability across diverse intersections.
5. Frequently Asked Questions
FAQ 1: Prioritizing Intersections for Analysis
Q: With limited resources, how should I determine which demographic intersections to prioritize for fairness assessment?
A: Prioritization should combine historical context, statistical considerations, and stakeholder input. First, research historical patterns of discrimination in your domain to identify intersections with documented disparities—these warrant particular attention. Second, consider statistical feasibility by prioritizing intersections with sufficient representation for reliable assessment, while implementing specialized statistical approaches for smaller but crucial subgroups. Third, engage with diverse stakeholders, particularly from marginalized communities, to understand which intersections raise the greatest concerns from their perspective. Finally, maintain flexibility in your analytical approach, starting with two-dimensional intersections before progressing to more complex combinations. Document prioritization decisions transparently to acknowledge potential blind spots in your assessment.
FAQ 2: Handling Intersections With Very Small Samples
Q: What techniques can I use when certain important intersectional subgroups have very few samples or even zero representation in my dataset?
A: For very small samples, implement a multi-faceted approach combining statistical techniques, domain knowledge, and transparency. Statistically, consider Bayesian methods that can incorporate prior knowledge and provide meaningful estimates with uncertainty quantification even for small samples. Hierarchical modeling approaches can "borrow strength" across related subgroups while acknowledging subgroup differences. For intersections with zero or near-zero representation, synthetic data approaches or targeted data collection may be necessary. Document confidence intervals and uncertainty estimates transparently, and consider establishing separate review processes for predictions affecting underrepresented intersections. Finally, recognize that technical solutions cannot fully compensate for fundamental data limitations—some assessment questions may remain unanswerable until more representative data becomes available.
6. Summary and Next Steps
Key Takeaways
Intersectional fairness assessment extends traditional approaches by examining how bias manifests across multiple, overlapping demographic dimensions rather than treating protected attributes in isolation. The key concepts from this Unit include:
- Intersectionality theory provides the conceptual foundation for understanding how multiple aspects of identity interact to create unique experiences of privilege or disadvantage that cannot be understood by examining each dimension separately.
- Simpson's Paradox explains mathematically how bias against specific intersectional groups can remain hidden when evaluating aggregate fairness metrics, highlighting why single-attribute assessment is insufficient.
- Multi-dimensional fairness metrics extend traditional fairness measures to simultaneously assess performance across multiple protected attributes and their intersections, capturing bias patterns that single-attribute assessments would miss.
- Small sample challenges create statistical difficulties when evaluating fairness for intersections with limited representation, necessitating specialized approaches that can provide reliable assessment despite data limitations.
These concepts directly address our guiding questions by explaining why intersectional assessment is essential for comprehensive fairness evaluation and providing methodological approaches for implementing such assessment despite practical challenges.
Application Guidance
To apply these concepts in your practical work:
- Extend fairness assessments beyond individual protected attributes to examine relevant intersections.
- Implement systematic comparisons between single-attribute and intersectional metrics to detect Simpson's Paradox effects.
- Apply appropriate statistical techniques when assessing fairness for intersections with limited representation.
- Develop visualization approaches that effectively communicate multi-dimensional fairness results.
For organizations new to intersectional assessment, start by examining two-attribute intersections with sufficient representation, then progressively incorporate more complex analyses as capabilities develop.
Looking Ahead
In the next Unit, we will build on this foundation by examining statistical significance and robustness in fairness measurement. You will learn how to implement confidence interval estimation, significance testing, and sensitivity analysis for fairness metrics, addressing the statistical validation challenges introduced in this Unit.
The intersectional perspective we have developed here will directly inform that statistical work by highlighting the particular challenges that arise when validating fairness metrics across demographic intersections with varied representation. Understanding both intersectional fairness and statistical validation is essential for developing reliable assessment approaches that provide meaningful insights despite data limitations and other practical constraints.
References
Buolamwini, J., & Gebru, T. (2018). Gender shades: Intersectional accuracy disparities in commercial gender classification. In Proceedings of the 1st Conference on Fairness, Accountability, and Transparency (pp. 77–91). https://proceedings.mlr.press/v81/buolamwini18a.html
Crenshaw, K. (1989). Demarginalizing the intersection of race and sex: A black feminist critique of antidiscrimination doctrine, feminist theory, and antiracist politics. University of Chicago Legal Forum, 1989(1), 139–167.
Foulds, J. R., Islam, R., Keya, K. N., & Pan, S. (2020). An intersectional definition of fairness. In 2020 IEEE 36th International Conference on Data Engineering (ICDE) (pp. 1946–1949). IEEE. https://doi.org/10.1109/ICDE48307.2020.00203
Kearns, M., Neel, S., Roth, A., & Wu, Z. S. (2018). Preventing fairness gerrymandering: Auditing and learning for subgroup fairness. In Proceedings of the 35th International Conference on Machine Learning (pp. 2564–2572). https://proceedings.mlr.press/v80/kearns18a.html
Mayson, S. G. (2018). Bias in, bias out. Yale Law Journal, 128(8), 2218-2300. https://www.yalelawjournal.org/article/bias-in-bias-out
Unit 4
Unit 4: Statistical Significance and Robustness
1. Conceptual Foundation and Relevance
Guiding Questions
- Question 1: How can we ensure that measured fairness disparities represent genuine issues rather than statistical artifacts or random variation?
- Question 2: What statistical methodologies enable robust fairness evaluation across demographic groups with different sample sizes, distributions, and representational characteristics?
Conceptual Context
Statistical validity is the critical bridge between fairness measurement and meaningful intervention. While previous Units have established various fairness metrics, they remain incomplete without rigorous statistical analysis that distinguishes genuine disparities from random variation. Fairness metrics calculated on finite samples inevitably contain uncertainty, making it essential to quantify confidence in observed disparities before committing resources to address them.
This statistical perspective is particularly vital because fairness interventions can involve significant trade-offs with other system objectives. Without statistical validation, organizations risk implementing costly interventions for disparities that appear significant but actually represent random fluctuations—or worse, failing to address genuine disparities because they appear smaller than they truly are due to sampling variability or measurement error.
Building directly on the fairness metrics established in previous Units, this Unit examines how to assess their statistical validity, determine confidence intervals, conduct hypothesis testing, and ensure robustness across different sampling conditions. These statistical techniques will directly inform the Fairness Metrics Tool we will develop in Unit 5, providing methodologies for quantifying uncertainty in fairness assessments and establishing thresholds for meaningful disparities.
2. Key Concepts
Uncertainty in Fairness Metrics
Fairness metrics calculated on finite samples contain inherent uncertainty, creating the potential for both false positives (detecting "unfairness" where none exists) and false negatives (missing genuine unfairness) in assessment. This concept is fundamental to AI fairness because without quantifying this uncertainty, practitioners cannot determine whether observed disparities warrant intervention or merely represent random variation.
Uncertainty connects to the fairness metrics explored in previous Units by establishing confidence bounds around measured values. A demographic parity difference of 5% might appear significant, but if statistical analysis reveals a 95% confidence interval of [-2%, 12%], we cannot confidently conclude whether a genuine disparity exists or in which direction it operates.
As Agarwal et al. (2021) demonstrate in their work on confidence intervals for fairness assessments, the uncertainty in fairness metrics often exceeds practitioners' expectations, particularly for metrics calculated on minority groups with limited representation. Their analysis of real-world datasets showed that fairness metrics calculated on samples of a few thousand instances can have confidence intervals spanning 10 percentage points or more, rendering precise fairness claims impossible without appropriate statistical qualification (Agarwal et al., 2021).
For the Fairness Metrics Tool we will develop, quantifying uncertainty is essential because it establishes when fairness disparities are statistically significant enough to warrant intervention. This statistical foundation prevents both overreaction to random variations and complacency toward genuine disparities that might appear small due to sampling variance.
The key components of uncertainty quantification include:
- Confidence Interval Estimation for fairness metrics, which provides bounds within which the true value likely lies.
- Standard Error Calculation that quantifies the precision of fairness metric estimates.
- Sampling Distribution Modeling for different fairness metrics, accounting for their specific mathematical properties.
- Uncertainty Visualization techniques that effectively communicate confidence bounds to stakeholders.
Statistical Significance Testing
Statistical significance testing provides formal methodologies for determining whether observed fairness disparities likely represent genuine effects rather than random variation. This concept is crucial for AI fairness because it establishes a systematic approach for deciding which disparities warrant intervention, preventing both unnecessary actions based on statistical noise and inaction toward genuine problems.
Significance testing builds directly on uncertainty quantification by translating confidence intervals into formal hypothesis tests. These tests determine whether observed fairness disparities are statistically distinguishable from zero (or another reference value), given the available evidence and a specified significance threshold.
Hardt, Price, and Srebro (2016) emphasize the importance of statistical significance in their landmark paper on equal opportunity in supervised learning. They demonstrate how naive application of fairness constraints without significance testing can lead to interventions that address phantom disparities while potentially introducing new fairness issues through unnecessary adjustments (Hardt, Price, & Srebro, 2016).
For our Fairness Metrics Tool, significance testing will provide a principled basis for determining when fairness disparities cross the threshold from "potential concern" to "actionable issue." This statistical rigor helps organizations prioritize intervention efforts toward disparities that are most likely to represent genuine fairness issues rather than statistical artifacts.
The primary methodologies for significance testing in fairness assessment include:
- Hypothesis Testing formulations for different fairness metrics, typically using null hypotheses of no disparity.
- p-value Calculation that quantifies the probability of observing the measured disparity (or a more extreme one) under the null hypothesis.
- Multiple Comparison Adjustment techniques that account for the increased error risk when testing multiple fairness hypotheses simultaneously.
- Effect Size Estimation that complements significance testing by quantifying the magnitude of disparities in standardized units.
Small Sample Challenges
Small sample sizes for minority groups create unique statistical challenges for fairness assessment, potentially leading to unreliable metrics with excessive variance or systematic bias. This concept is essential for AI fairness because many fairness applications involve demographic groups with limited representation, making standard statistical approaches potentially misleading or ineffective.
Small sample challenges intersect with both uncertainty quantification and significance testing by amplifying the difficulty of drawing reliable conclusions for underrepresented groups. When sample sizes differ dramatically across groups, traditional statistical approaches may produce misleading results that either obscure genuine disparities or suggest spurious ones.
Kearns et al. (2018) highlight this challenge in their work on fairness for intersectional subgroups, demonstrating that as groups become more specific (e.g., Black women over 60 with a specific educational background), sample sizes often become too small for reliable statistical inference using conventional methods. Their research showed that even with datasets containing millions of examples, certain intersectional subgroups might have only dozens of representatives, creating substantial challenges for fairness assessment (Kearns et al., 2018).
For the Fairness Metrics Tool, addressing small sample challenges is crucial for ensuring that fairness assessments remain valid across demographic groups with different levels of representation. Without appropriate statistical techniques for small samples, fairness assessments might systematically overlook issues affecting minority groups simply because they lack the statistical power to detect them.
Key approaches for addressing small sample challenges include:
- Bayesian Methods that incorporate prior knowledge to improve estimation for small groups.
- Hierarchical Modeling techniques that leverage information from larger groups to enhance estimation for smaller ones.
- Exact Statistical Tests designed specifically for small samples.
- Resampling Methods like bootstrapping that provide alternative approaches to uncertainty quantification.
Robustness in Fairness Evaluation
Robustness in fairness evaluation refers to the stability and reliability of fairness metrics across different data subsets, time periods, and environmental conditions. This concept is fundamental to AI fairness because without robustness, fairness assessments might reflect transient patterns or dataset peculiarities rather than genuine disparities requiring intervention.
Robustness connects to the previous statistical concepts by extending them beyond single-sample analysis to examine consistency across different evaluation conditions. While uncertainty quantification and significance testing address statistical rigor within a single analysis, robustness examines whether these findings generalize beyond the specific dataset or time period analyzed.
Friedler et al. (2019) demonstrate the importance of robustness in their comparative analysis of fairness interventions. Their work shows how fairness disparities and intervention effects can vary dramatically across different random splits of the same dataset, revealing the potential instability of fairness assessments when robustness is not explicitly evaluated (Friedler et al., 2019).
For our Fairness Metrics Tool, ensuring robustness will be essential for developing fairness assessments that remain valid and actionable in real-world deployment. Without robustness testing, organizations risk implementing interventions based on fairness assessments that might not generalize to new data or changing conditions.
Key approaches for evaluating and ensuring robustness include:
- Cross-Validation techniques applied specifically to fairness metrics.
- Sensitivity Analysis that examines how fairness assessments change under different conditions.
- Stability Testing across random data splits, time periods, or environmental factors.
- Adversarial Evaluation that stress-tests fairness properties under challenging conditions.
Domain Modeling Perspective
From a domain modeling perspective, statistical validity in fairness assessment connects to specific components of ML systems:
- Sampling Process: How data collection and sampling procedures influence the statistical properties of fairness metrics.
- Metric Calculation: How mathematical formulations of fairness metrics translate to statistical estimators with specific properties.
- Validation Framework: How statistical testing methodologies integrate with model evaluation workflows.
- Decision Process: How statistical significance thresholds inform intervention decisions.
- Monitoring System: How robustness testing ensures sustained fairness across deployment conditions.
This domain mapping helps you understand how statistical considerations influence different components of ML systems rather than viewing them as abstract mathematical concepts. The Fairness Metrics Tool will leverage this mapping to design fairness evaluation procedures that incorporate statistical rigor throughout the model lifecycle.

Conceptual Clarification
To clarify these abstract statistical concepts, consider the following analogies:
- Uncertainty in fairness metrics is similar to polling in elections. Just as election polls based on samples of voters contain margins of error (e.g., "Candidate A leads by 5% ± 3%"), fairness metrics calculated on dataset samples contain confidence intervals that express their precision. A fairness disparity of 10% with a confidence interval of ±12% is like a political "lead" that falls within the margin of error—it suggests a potential difference but doesn't provide statistical confidence that one exists. Just as responsible election coverage reports both the estimated lead and the margin of error, responsible fairness assessment must report both measured disparities and their statistical uncertainty.
- Statistical significance testing functions like a company's financial materiality threshold. Just as a company might only investigate financial discrepancies exceeding a certain dollar amount (since smaller differences could represent rounding errors or acceptable variance), significance testing establishes which fairness disparities are large enough—relative to their statistical uncertainty—to warrant formal investigation and potential intervention. This threshold prevents both overreaction to minor, statistically insignificant disparities and complacency toward genuine issues that exceed the materiality threshold.
- Small sample challenges resemble product quality testing with limited inventory. When assessing a large product batch, you can test many units to get reliable quality estimates. However, for limited-production specialty items, you might have only a few units to test, making quality assessment less certain. Similarly, fairness assessment for well-represented groups (like the large product batch) provides more statistical confidence than for minority groups with limited samples. Special statistical techniques for small samples are analogous to specialized testing protocols designed specifically for limited-production items, where standard quality control procedures would be inappropriate.
Intersectionality Consideration
Statistical validity issues become particularly pronounced when examining fairness at demographic intersections. As individuals are categorized into increasingly specific intersectional subgroups (e.g., from "women" to "Black women" to "Black women over 50"), sample sizes often decrease exponentially, creating unique statistical challenges that standard approaches fail to address adequately.
Kearns et al. (2018) highlighted how traditional fairness metrics often miss discrimination against specific intersectional subgroups because statistical power decreases with group specificity. Their work demonstrated that even when a model appears fair when evaluated for race and gender separately, it may still discriminate against specific intersections like "Asian women" or "Hispanic men" (Kearns et al., 2018).
Similarly, Buolamwini and Gebru's (2018) landmark "Gender Shades" research revealed how facial recognition systems exhibited dramatically higher error rates for darker-skinned women than for either darker-skinned men or lighter-skinned women. These intersectional effects could have remained statistically invisible without specialized methodologies designed to maintain statistical power at demographic intersections (Buolamwini & Gebru, 2018).
For the Fairness Metrics Tool, addressing these intersectional statistical challenges requires:
- Hierarchical modeling approaches that borrow statistical strength across related subgroups.
- Bayesian techniques that incorporate prior knowledge to improve estimation for small intersectional groups.
- Specialized visualization methods that communicate uncertainty across intersectional categories.
- Multiple testing corrections that account for the increased false discovery risk when examining numerous intersectional subgroups.
By incorporating these intersectional statistical considerations, the framework will enable more reliable fairness assessment across demographic intersections rather than limiting analysis to broad categories where statistical power is highest but potentially important disparities remain hidden.
3. Practical Considerations
Implementation Framework
To systematically ensure statistical validity in fairness assessment, implement this structured methodology:
-
Fairness Metric Uncertainty Analysis:
-
Calculate point estimates for relevant fairness metrics based on application requirements.
- Compute standard errors and construct confidence intervals using appropriate statistical methods.
- Visualize uncertainty alongside point estimates in fairness reports and dashboards.
-
Adjust confidence interval methods based on sample size, using exact methods for smaller groups.
-
Statistical Significance Determination:
-
Formulate specific null hypotheses for each fairness metric (typically no disparity between groups).
- Calculate appropriate test statistics and p-values using methods matched to data characteristics.
- Apply multiple testing corrections when evaluating numerous fairness hypotheses simultaneously.
-
Document both statistical significance and effect sizes in fairness assessment reports.
-
Small Group Analysis:
-
Identify demographic groups with limited representation and flag metrics with high uncertainty.
- Implement Bayesian or hierarchical modeling approaches for improved small-sample estimation.
- Consider aggregating across similar small groups when appropriate to increase statistical power.
-
Document limitations explicitly when sample sizes prevent reliable statistical inference.
-
Robustness Verification:
-
Perform cross-validation of fairness metrics across multiple random data splits.
- Conduct temporal stability analysis when longitudinal data are available.
- Implement sensitivity testing to environmental factors and data distribution shifts.
- Document robustness findings alongside primary fairness metrics.
These methodologies integrate with standard ML workflows by extending model evaluation to include statistical validation of fairness properties. While adding analytical complexity, these approaches ensure that fairness assessments lead to justified interventions rather than responses to statistical noise.
Implementation Challenges
When implementing statistical validation for fairness metrics, practitioners commonly face these challenges:
-
Balancing Statistical Rigor with Practical Action: Strict statistical standards might prevent addressing genuine fairness concerns that fail to reach significance thresholds, particularly for minority groups. Address this by:
-
Implementing tiered significance thresholds that trigger different levels of response (e.g., monitoring, investigation, immediate intervention).
- Complementing significance testing with effect size analysis to prioritize practically meaningful disparities.
-
Developing Bayesian decision frameworks that incorporate the costs of both false positives and false negatives in fairness assessment.
-
Communicating Statistical Concepts to Non-Technical Stakeholders: Statistical uncertainty and significance can be difficult for decision-makers to understand. Address this by:
-
Developing visual representations that intuitively communicate uncertainty without requiring statistical expertise.
- Creating standardized fairness reports with clear indicators that integrate statistical considerations.
- Establishing decision protocols that translate statistical findings into actionable recommendations.
Successfully implementing these approaches requires computational resources for statistical simulation and bootstrapping procedures, statistical expertise in uncertainty quantification and hypothesis testing, and organizational willingness to accept probabilistic rather than binary fairness assessments.
Evaluation Approach
To assess whether your statistical validation procedures are effective, implement these evaluation strategies:
-
Statistical Coverage Analysis:
-
Generate simulated datasets with known fairness properties to verify that confidence intervals achieve their nominal coverage rates.
- Calculate the percentage of confidence intervals that contain the true fairness metric values in simulation studies.
-
Establish minimum coverage requirements based on application criticality (typically 90% or 95%).
-
False Discovery Rate Control:
-
Measure the proportion of "significant" fairness disparities that represent false positives in simulation studies.
- Verify that multiple testing procedures effectively control error rates at the specified levels.
-
Establish acceptable false discovery thresholds based on application context and intervention costs.
-
Robustness Verification:
-
Quantify the stability of fairness metrics across different data splits using dispersion statistics.
- Establish thresholds for acceptable variability based on application requirements.
- Document robustness characteristics as part of standard fairness reporting.
These evaluation approaches should be integrated with your organization's broader model assessment framework, providing quantitative measures of statistical reliability alongside the fairness metrics themselves.
4. Case Study: Lending Algorithm Fairness Assessment
Scenario Context
A financial institution has developed a machine learning model to predict default risk for personal loan applications. The algorithm uses credit history, income, employment stability, and other financial indicators to generate risk scores that determine loan approval and interest rates. Key stakeholders include the bank's risk management team concerned with accurate default prediction, regulatory compliance officers monitoring fair lending requirements, and customers from diverse demographic backgrounds seeking equitable access to credit.
Fairness is particularly critical in this domain due to historical patterns of lending discrimination. The Equal Credit Opportunity Act explicitly prohibits discrimination based on race, gender, age, and other protected characteristics, making statistical validity in fairness assessment both an ethical and legal requirement.
Problem Analysis
Applying core concepts from this Unit reveals several statistical challenges in assessing the lending algorithm's fairness:
- Uncertainty in Fairness Metrics: Initial analysis shows an apparent demographic parity disparity of 8% in approval rates between white and Black applicants. However, Black applicants constitute only 12% of the dataset, creating substantial uncertainty in this metric. When confidence intervals are calculated, the disparity has a 95% confidence interval of [3%, 13%], making the precise magnitude unclear though the direction appears consistent.
- Statistical Significance Challenges: The fairness assessment examines multiple metrics (demographic parity, equal opportunity, equalized odds) across several protected attributes (race, gender, age), creating 15 distinct hypothesis tests. Without correction for multiple comparisons, several disparities appear statistically significant, but after applying Benjamini-Hochberg correction to control the false discovery rate, only the racial disparity in approval rates remains significant.
- Small Sample Concerns: For certain intersectional categories, such as Black women over 50, the sample contains fewer than 100 applicants, creating extreme uncertainty in fairness metrics. Traditional confidence intervals for these groups span more than 20 percentage points, rendering precise fairness assessment impossible without specialized statistical approaches.
- Robustness Questions: Cross-validation analysis reveals that fairness disparities vary substantially across different random splits of the data, with the demographic parity difference for gender ranging from -2% to +7% depending on the specific split. This variability raises questions about whether observed disparities represent genuine fairness issues or dataset artifacts.
From an intersectional perspective, the statistical challenges are most severe at specific demographic intersections. While the model appears to have similar approval rates for men and women overall, further analysis reveals potentially significant disparities for specific intersections like Hispanic women and older Asian men, though small sample sizes create substantial uncertainty in these assessments.
Solution Implementation
To address these statistical challenges, the team implemented a comprehensive approach:
-
For Uncertainty Quantification, they:
-
Implemented bootstrap confidence intervals for all fairness metrics, using 10,000 resamples to ensure stable estimation.
- Developed specialized visualization dashboards showing both point estimates and confidence intervals for fairness metrics.
- Created "uncertainty-aware" fairness reports that explicitly communicated the precision limitations for all metrics.
-
Established different confidence levels (90%, 95%, 99%) to support tiered decision-making based on statistical certainty.
-
For Statistical Significance, they:
-
Implemented formal hypothesis testing for each fairness metric using appropriate statistical tests.
- Applied Benjamini-Hochberg procedure to control the false discovery rate at 5% across multiple comparisons.
- Complemented significance results with standardized effect sizes to prioritize practically meaningful disparities.
-
Established a tiered response protocol based on both statistical significance and effect magnitude.
-
For Small Sample Challenges, they:
-
Implemented Bayesian hierarchical models for intersectional subgroups that borrowed statistical strength across related categories.
- Developed adaptive thresholds that adjusted significance requirements based on available sample sizes.
- Created explicit documentation standards for metrics with high uncertainty due to sample limitations.
-
Designed aggregation approaches that combined similar small groups when appropriate to increase statistical power.
-
For Robustness Verification, they:
-
Performed 5-fold cross-validation of all fairness metrics to assess stability across data splits.
- Conducted temporal analysis using data from different time periods to verify consistency.
- Implemented stress testing using synthetic data modifications to examine sensitivity to distribution shifts.
- Established robustness requirements that fairness disparities must meet before triggering interventions.
Throughout implementation, they maintained explicit focus on intersectional effects, using specialized statistical techniques to improve estimation for demographic intersections despite limited sample sizes.
Outcomes and Lessons
The implementation resulted in several key improvements to fairness assessment:
- Statistical validation revealed that while racial disparities in approval rates were genuine and robust, several other apparent disparities were not statistically significant after multiple testing correction.
- Confidence intervals provided decision-makers with a more nuanced understanding of fairness concerns, enabling proportionate responses based on statistical certainty.
- Hierarchical modeling improved estimation for intersectional groups, revealing previously hidden disparities for specific demographic combinations that would have remained invisible with traditional approaches.
- Robustness testing saved resources by preventing intervention on fairness disparities that proved unstable across data splits or time periods.
Key challenges remained, including communicating complex statistical concepts to non-technical stakeholders and balancing statistical rigor with timely intervention for potential fairness issues.
The most generalizable lessons included:
- The critical importance of confidence intervals for fairness metrics, which often revealed that disparities were neither as large nor as small as point estimates suggested.
- The value of multiple testing correction, which prevented several potentially costly interventions for disparities that likely represented statistical noise.
- The effectiveness of hierarchical modeling for intersectional fairness assessment, which revealed patterns that would have remained hidden with traditional approaches.
These insights directly informed the development of the Fairness Metrics Tool, particularly in establishing statistical validation as a core component rather than an optional addition to fairness assessment.
5. Frequently Asked Questions
FAQ 1: Handling Limited Demographic Data
Q: How can I ensure statistical validity in fairness assessment when my dataset lacks comprehensive demographic information due to privacy restrictions or collection limitations?
A: When demographic data are limited, combine multiple approaches for statistically valid assessment: First, use proxy-based analysis where appropriate, developing validated proxies for protected attributes while documenting their limitations and validation evidence. Second, implement sensitivity analysis that examines how fairness conclusions might change under different assumptions about missing demographic information. Third, where possible, conduct limited demographic audits on smaller, consent-based samples to validate findings from proxy-based approaches. Finally, use simulation studies that model potential demographic distributions based on population statistics to establish bounds on possible fairness disparities. Always explicitly document assumptions, limitations, and uncertainty ranges when working with incomplete demographic information, and consider these limitations when establishing intervention thresholds.
FAQ 2: Setting Statistical Thresholds
Q: How should I determine appropriate statistical thresholds for fairness intervention, balancing the risks of both false positives (unnecessary interventions) and false negatives (missed fairness issues)?
A: Setting appropriate statistical thresholds requires considering both statistical principles and application-specific factors. Start by explicitly modeling the costs of both error types in your specific context—what are the consequences of intervening unnecessarily versus missing genuine fairness issues? For high-stakes applications like lending or healthcare, you might accept more false positives to minimize the risk of missing genuine disparities. Implement tiered thresholds that trigger different responses based on statistical confidence: for instance, disparities significant at p<0.1 might trigger monitoring, while those at p<0.01 might require immediate intervention. Consider adjusting thresholds based on group size, potentially using less stringent criteria for smaller groups where statistical power is limited. Finally, complement significance testing with effect size measures, prioritizing disparities that are both statistically significant and practically meaningful. Document your threshold selection rationale to ensure consistency and enable appropriate adjustment as more data become available.
6. Summary and Next Steps
Key Takeaways
Statistical validity is the foundation that transforms fairness measurement from theoretical exercise to actionable insight. The key concepts from this Unit include:
- Uncertainty quantification for fairness metrics enables understanding the precision of disparity measures and constructing appropriate confidence intervals.
- Statistical significance testing provides systematic approaches for determining which fairness disparities likely represent genuine issues rather than random variation.
- Small sample methodologies address the unique challenges of assessing fairness for minority groups and intersectional categories with limited representation.
- Robustness verification ensures that fairness assessments remain valid across different data splits, time periods, and environmental conditions.
These concepts directly address our guiding questions by establishing methodologies for distinguishing genuine fairness issues from statistical artifacts and enabling reliable assessment across demographic groups with varying representation.
Application Guidance
To apply these concepts in your practical work:
- Implement confidence interval calculation for all fairness metrics rather than relying solely on point estimates.
- Establish formal hypothesis testing procedures with appropriate corrections for multiple comparisons.
- Develop specialized approaches for groups with limited representation, particularly at demographic intersections.
- Verify the robustness of fairness findings through cross-validation and sensitivity analysis before committing to interventions.
For organizations new to these considerations, start by focusing on basic uncertainty quantification through confidence intervals, then progressively incorporate more sophisticated statistical approaches as organizational capabilities develop.
Looking Ahead
In the next Unit, we will integrate all components developed throughout this Part into a comprehensive framework for fairness metrics selection, implementation, and evaluation. The statistical validation approaches we have examined here will serve as a critical foundation for this integrated framework, ensuring that fairness assessments not only measure the right properties but do so with appropriate statistical rigor.
The Fairness Metrics Tool will synthesize the group fairness metrics from Unit 1, the individual fairness measures from Unit 2, the intersectional assessment approaches from Unit 3, and the statistical validation techniques from this Unit into a cohesive system for fairness evaluation. By integrating these components, we will develop a framework that enables systematic, statistically valid fairness assessment across diverse application contexts.
References
Agarwal, N., Gupta, H., Sharma, S., Saxena, V., Srinivasan, A., & Vardhan, M. (2021). Mitigating bias in machine learning using confidence intervals for fairness metrics. In Proceedings of the 2021 AAAI/ACM Conference on AI, Ethics, and Society (pp. 23-34). https://dl.acm.org/doi/10.1145/3461702.3462533
Buolamwini, J., & Gebru, T. (2018). Gender shades: Intersectional accuracy disparities in commercial gender classification. In Proceedings of the 1st Conference on Fairness, Accountability, and Transparency (pp. 77-91). https://proceedings.mlr.press/v81/buolamwini18a.html
Friedler, S. A., Scheidegger, C., Venkatasubramanian, S., Choudhary, S., Hamilton, E. P., & Roth, D. (2019). A comparative study of fairness-enhancing interventions in machine learning. In Proceedings of the Conference on Fairness, Accountability, and Transparency (pp. 329-338). https://dl.acm.org/doi/10.1145/3287560.3287589
Hardt, M., Price, E., & Srebro, N. (2016). Equality of opportunity in supervised learning. In Advances in Neural Information Processing Systems (pp. 3315-3323). https://proceedings.neurips.cc/paper/2016/file/9d2682367c3935defcb1f9e247a97c0d-Paper.pdf
Kearns, M., Neel, S., Roth, A., & Wu, Z. S. (2018). Preventing fairness gerrymandering: Auditing and learning for subgroup fairness. In International Conference on Machine Learning (pp. 2564-2572). https://proceedings.mlr.press/v80/kearns18a.html
Veale, M., & Binns, R. (2017). Fairer machine learning in the real world: Mitigating discrimination without collecting sensitive data. Big Data & Society, 4(2), 2053951717743530. https://doi.org/10.1177/2053951717743530
Zhang, J., & Walsh, J. (2021). Bootstrap confidence intervals for fairness metrics. Journal of Statistical Computation and Simulation, 91(16), 3225-3244. https://doi.org/10.1080/00949655.2021.1913218
Unit 5
Unit 5: Fairness Metrics Tool
1. Introduction
In Part 4, you learned about group fairness metrics, individual fairness measures, intersectional fairness assessment, and statistical validation techniques. Now it's time to apply these concepts by developing a practical tool that helps engineering teams select, implement, and interpret appropriate fairness metrics. The Fairness Metrics Tool you'll create will serve as the fourth component of the Sprint 1 Project - Fairness Audit Playbook, ensuring that fairness assessments are based on rigorous quantitative evaluation rather than intuition.
2. Context
Imagine you are a staff engineer at a tech company that uses AI systems across multiple products. You are continuing your collaboration with the engineering team developing an AI-powered internal loan application system. After using your Historical Context Assessment Tool, Fairness Definition Selection Tool, and Bias Source Identification Tool, they've identified relevant historical patterns, selected appropriate fairness definitions, and mapped potential bias sources. Now they want to quantitatively measure whether their system meets their fairness objectives.
After discussions with the team, you've agreed to develop another tool that will help them select, implement, and interpret appropriate fairness metrics based on their selected fairness definitions and identified bias sources. You'll also prepare a short case study demonstrating how to use your tool for their loan application system.
You are once again designing this tool with reusability in mind - all teams will be able to use it to systematically evaluate fairness. You've named it the "Fairness Metrics Tool."
3. Objectives
By completing this project component, you will practice:
- Translating fairness definitions into metrics.
- Selecting appropriate statistical validation approaches for different metrics.
- Creating communication strategies for fairness results.
- Developing practical implementation guidance for technical teams.
- Integrating quantitative assessment with previous fairness components.
4. Requirements
Your Fairness Metrics Tool must include:
- A metric selection methodology that connects fairness definitions to specific metrics.
- Guidance on how to conduct statistical validation.
- Visualization and reporting templates.
- User documentation that guides users on how to apply the tool in practice.
- A case study demonstrating the tool's application to an internal loan application system.
5. Sample Solution
The following solution was developed by a former colleague and can serve as an example for your own work. Note that this solution wasn't specifically designed for AI applications and lacks some key components that your tool should include.
5.1 Metric Selection
This decision tree helps match fairness definitions to appropriate metrics:
-
Problem Type Classification
-
Classification → Go to Step 2
- Regression → Go to Step 5
- Ranking → Go to Step 8
Note. It seems that steps 2-4 are missing in your colleague's document.
-
Regression: Primary Fairness Definition
-
Statistical Parity → Select: Group Outcome Difference, Distribution Comparison metrics
- Bounded Group Loss → Select: Maximum Group Loss, Group Error Ratio
-
Individual Fairness → Select: Individual Consistency Measure, Input-Output Sensitivity
-
Regression: Error Direction Importance
-
Overprediction more harmful → Add Positive Residual Difference
- Underprediction more harmful → Add Negative Residual Difference
-
Both harmful → Add Absolute Residual Difference
-
Regression: Uncertainty Requirements
-
Uncertainty estimates provided → Add Prediction Interval Coverage metrics
-
No uncertainty provided → No additional metrics
-
Ranking: Primary Fairness Definition
-
Exposure Parity → Select: Exposure Ratio, Normalized Discounted Cumulative Gain Difference
- Representation Parity → Select: Group Representation Ratio, Top-k Proportion Difference
- Individual Fairness → Select: Rank-Consistency Score, Similar-Item Rank Distance
5.2 Statistical Validation
Bootstrap Confidence Intervals for Group Fairness Metrics
- Resample with replacement from original dataset.
- Calculate fairness metric on each resampled dataset.
- Determine confidence intervals from the resulting distribution.
- Report 95% confidence intervals for all metrics.
Small Sample Handling
- For groups with fewer than 100 samples, use Bayesian approaches with weakly informative priors.
- Report credible intervals rather than confidence intervals.
- Explicitly note small sample sizes in visualization and reporting.
5.3 Visualization and Reporting System
Fairness Disparity Chart
- Bar chart showing primary metrics across groups with confidence intervals.
- Color-coding indicating statistical significance.
- Reference lines for acceptable thresholds.
Intersectional Heatmap
- Heatmap showing metric values across all intersectional groups.
- Color gradient indicating magnitude of disparities.
- Cell size or opacity indicating sample size.
6. Case Study: Internal Hiring System
This case study demonstrates how to apply the Fairness Metrics Tool to an internal hiring system.
6.1 System Context
The team is developing an AI-powered resume screening system that automatically evaluates job applications and ranks candidates for software engineering positions. The Historical Context Assessment identified patterns of gender and age discrimination in tech hiring. The Fairness Definition Selection process prioritized equal opportunity as the primary fairness definition. The Bias Source Identification Tool highlighted historical bias in past hiring decisions, representation bias in training data, and measurement bias in how qualifications are encoded.
6.2 Step 1: Metric Selection
Based on the fairness definitions and bias sources, the team selected:
- True Positive Rate Difference (primary metric based on equal opportunity).
- False Negative Rate Difference (secondary metric based on the cost of missing qualified candidates).
- Demographic Parity Difference (monitoring metric based on secondary definition).
- Intersectional Equal Opportunity (to address intersectional concerns).
6.3 Step 2: Implementation and Calculation
The team implemented these metrics with the following results:
- True Positive Rate Difference: 0.18 (95% CI: 0.12-0.24)
- False Negative Rate Difference: 0.21 (95% CI: 0.15-0.27)
- Demographic Parity Difference: 0.14 (95% CI: 0.09-0.19)
- Intersectional Equal Opportunity: 0.27 (95% CI: 0.18-0.36)
All disparities were statistically significant (p < 0.01).
6.4 Step 3: Visualization and Reporting
Note. The visualizations were created with an external tool, but the link to them is now broken.