Part 4: Prediction-Level Interventions (Post-Processing)
Context
Post-processing interventions fix fairness issues after model training, offering solutions even for already-deployed systems.
This Part explores techniques that transform model outputs to satisfy fairness criteria without retraining. You'll learn to adjust decision thresholds, recalibrate probability estimates, and transform scores to achieve fairness. Many organizations face practical constraints that make model retraining costly or impossible—deployed models serving thousands of users, legacy systems resistant to change, or regulatory environments requiring extensive validation for new models.
Threshold optimization sets different decision boundaries for different groups. A loan approval system might apply one threshold to male applicants and another to female applicants, ensuring equal opportunity despite different score distributions. Hardt et al. (2016) show how post-processing can achieve equal error rates across groups without sacrificing predictive power.
Calibration ensures probability estimates mean the same thing across groups. When a credit model says there's a 20% default risk, that probability should reflect reality regardless of the applicant's demographic attributes. Pleiss et al. (2017) demonstrate how miscalibration creates uneven impact when decisions rely on probability thresholds.
These techniques connect to different fairness definitions. Score transformation serves demographic parity; threshold adjustment achieves equal opportunity; calibration ensures equalized odds. Your choice shapes who gets loans, jobs, or housing.
The Post-Processing Fairness Toolkit you'll develop in Unit 5 represents the fourth component of the Fairness Intervention Playbook (Sprint Project). This toolkit will help you select appropriate post-processing techniques based on fairness goals, model outputs, and operational constraints.
Learning Objectives
By the end of this Part, you will be able to:
- Implement threshold optimization for fairness criteria. You will develop methods that identify optimal decision thresholds for different groups, enabling fair decisions in classification systems while maintaining performance.
- Design calibration techniques that equalize error meaning across groups. You will create approaches ensuring probability estimates have consistent interpretation regardless of protected attributes, preventing disparate impact in risk assessment applications.
- Apply score transformation methods that satisfy fairness constraints. You will implement techniques that modify raw scores to achieve fairness goals while preserving predictive ordering, balancing fairness with usefulness.
- Evaluate trade-offs between different post-processing approaches. You will assess how various techniques affect both fairness metrics and business objectives, making informed decisions about which interventions best suit specific contexts.
- Integrate post-processing methods into production environments. You will develop strategies for implementing fairness adjustments in deployed systems, creating practical solutions that improve fairness without system disruption.
Units
Unit 1
Unit 1: Threshold Optimization Techniques
1. Conceptual Foundation and Relevance
Guiding Questions
- Question 1: How can we adjust classification thresholds after model training to satisfy specific fairness definitions without requiring retraining or model modification?
- Question 2: What are the mathematical relationships between threshold selection and different fairness metrics, and how do we navigate the inherent trade-offs between them?
Conceptual Context
Threshold optimization represents one of the most accessible and powerful fairness interventions in your technical toolkit. Unlike pre-processing or in-processing techniques that require modifying data or model architecture, threshold optimization works directly with model outputs, making it applicable even to black-box models or systems where retraining is impractical.
This approach matters because classification decisions in machine learning typically involve applying a threshold to probability scores (e.g., classifying as "positive" when probability > 0.5). The critical insight is that using a single threshold for all demographic groups often perpetuates or amplifies existing biases, even when the underlying probability estimates are well-calibrated. By setting different thresholds for different groups, you can directly address disparities in false positive and false negative rates while minimizing accuracy loss.
As Hardt, Price, and Srebro (2016) demonstrated in their seminal paper, group-specific thresholds can satisfy fairness criteria such as equal opportunity or equalized odds without modifying the underlying model. This makes threshold optimization particularly valuable when working with fixed models, black-box systems, or environments where deployment speed matters more than theoretical elegance.
This Unit builds on the causal understanding you developed in Part 1 by providing concrete techniques to address specific fairness issues identified through causal analysis. It complements the pre-processing approaches from Part 2 and in-processing methods from Part 3 by offering interventions that can be applied after training is complete. The threshold optimization techniques you learn here will form a critical component of the Post-processing Calibration Guide you'll develop in Unit 5, enabling rapid fairness interventions in operational systems.
2. Key Concepts
Decision Boundaries and Classification Thresholds
Classification thresholds determine how continuous model outputs translate into discrete decisions. This concept forms the foundation of threshold optimization because adjusting these thresholds directly influences which instances receive positive versus negative predictions, affecting fairness metrics that depend on error distributions.
In standard practice, a single threshold (typically 0.5 for predicted probabilities) applies to all individuals regardless of group membership. This approach implicitly assumes that the error costs and optimal decision boundary are identical across groups. However, this assumption rarely holds in practice due to historical biases, data disparities, and differing base rates across demographic groups.
As Corbett-Davies et al. (2017) established, "when a single classification rule is applied to groups with different risk distributions, the resulting error rates will generally differ across groups, potentially violating fairness constraints." This occurs because the distributions of predicted probabilities often differ systematically between demographic groups due to both legitimate risk differences and algorithmic biases.
For example, in a loan approval system, the distribution of predicted default probabilities might differ between racial groups due to historical lending discrimination that affected the training data. Applying the same threshold to these different distributions produces disparate error rates—potentially denying loans to qualified applicants from disadvantaged groups at higher rates than others.
Threshold optimization addresses this issue by allowing different thresholds for different groups, directly targeting specific fairness metrics through these adjustments. This concept interacts directly with the mathematical fairness definitions from Part 2, providing an implementation pathway for definitions like demographic parity, equal opportunity, and equalized odds.
Mathematical Optimization for Fairness Criteria
Different fairness definitions translate into distinct mathematical objectives for threshold optimization. This concept is crucial because it enables you to tailor your threshold adjustments to the specific fairness criteria most relevant to your application.
Hardt et al. (2016) provided the formal framework for this approach, showing that for binary classification, we can achieve equal opportunity by selecting thresholds that equalize true positive rates across groups. Similarly, we can satisfy equalized odds by choosing thresholds that equalize both true positive rates and false positive rates. Demographic parity requires thresholds that produce equal selection rates regardless of group membership.
These objectives can be formalized as constraint optimization problems:
For equal opportunity, we seek thresholds tₐ for each group a such that:

For equalized odds, we extend this to include false positive rates:

For demographic parity, we aim for equal selection rates:

These objectives often conflict with performance metrics like accuracy or aggregate utility. Corbett-Davies et al. (2017) formalized this as a constrained optimization problem: maximize utility subject to fairness constraints, or equivalently, minimize the deviation from a desired fairness metric subject to utility constraints.
This mathematical framework enables you to choose appropriate thresholds that balance fairness requirements against performance objectives, making principled trade-offs rather than applying arbitrary adjustments.
ROC Curves and Fairness-Performance Trade-offs
Receiver Operating Characteristic (ROC) curves visualize the trade-off between true positive rates and false positive rates as a classification threshold varies. This concept is essential for threshold optimization because it provides a graphical framework for understanding how threshold adjustments affect both fairness and performance metrics.
Each point on the ROC curve represents the TPR and FPR achieved at a particular threshold value. Different demographic groups typically have different ROC curves, reflecting how the same model performs differently across groups. These group-specific curves form the basis for threshold optimization by showing all possible operating points for each group.
Kleinberg, Mullainathan, and Raghavan (2016) demonstrated that these trade-offs are often unavoidable due to mathematical impossibility results—in most real-world scenarios, we cannot simultaneously satisfy multiple fairness criteria while maintaining perfect prediction quality. This forces explicit choices about which fairness and performance metrics to prioritize.
For example, when optimizing thresholds for equal opportunity, you typically accept some reduction in overall accuracy to achieve equality in true positive rates. The ROC framework helps visualize this trade-off by showing how moving to different operating points on each group's curve affects both fairness and performance metrics.
The key insight is that threshold optimization doesn't eliminate the fundamental trade-offs between competing objectives—it simply provides a framework for navigating them explicitly. As Friedler et al. (2019) note, "post-processing approaches like threshold optimization make these trade-offs transparent, allowing practitioners to make informed decisions about the balance between fairness and utility."
Implementation With and Without Protected Attributes
Threshold optimization implementations vary based on whether protected attributes are available at decision time. This practical consideration is crucial because many applications face legal or ethical restrictions on using protected attributes during deployment, even for fairness purposes.
When protected attributes are available, you can implement group-specific thresholds directly, applying different decision rules based on group membership. As demonstrated by Hardt et al. (2016), this approach provides the most flexible optimization, allowing you to target specific fairness metrics precisely.
However, many contexts prohibit the use of protected attributes in decision-making, even for bias mitigation. For these scenarios, researchers have developed techniques that approximate group-specific thresholds without requiring protected attributes at decision time:
- Derived features approaches: As explored by Dwork et al. (2018), you can train a model to predict the appropriate threshold based on non-protected features that correlate with group membership but are legally permissible to use.
- Multiple threshold schemes: Lipton, Wang, and Smola (2018) demonstrated how multiple thresholds applied to all individuals can approximate group-fairness properties without explicit group identification.
These implementation variations allow you to apply threshold optimization even under legal constraints, though with some reduction in optimization flexibility. The Post-processing Calibration Guide you'll develop will need to include decision frameworks for selecting appropriate implementation approaches based on these practical constraints.
Domain Modeling Perspective
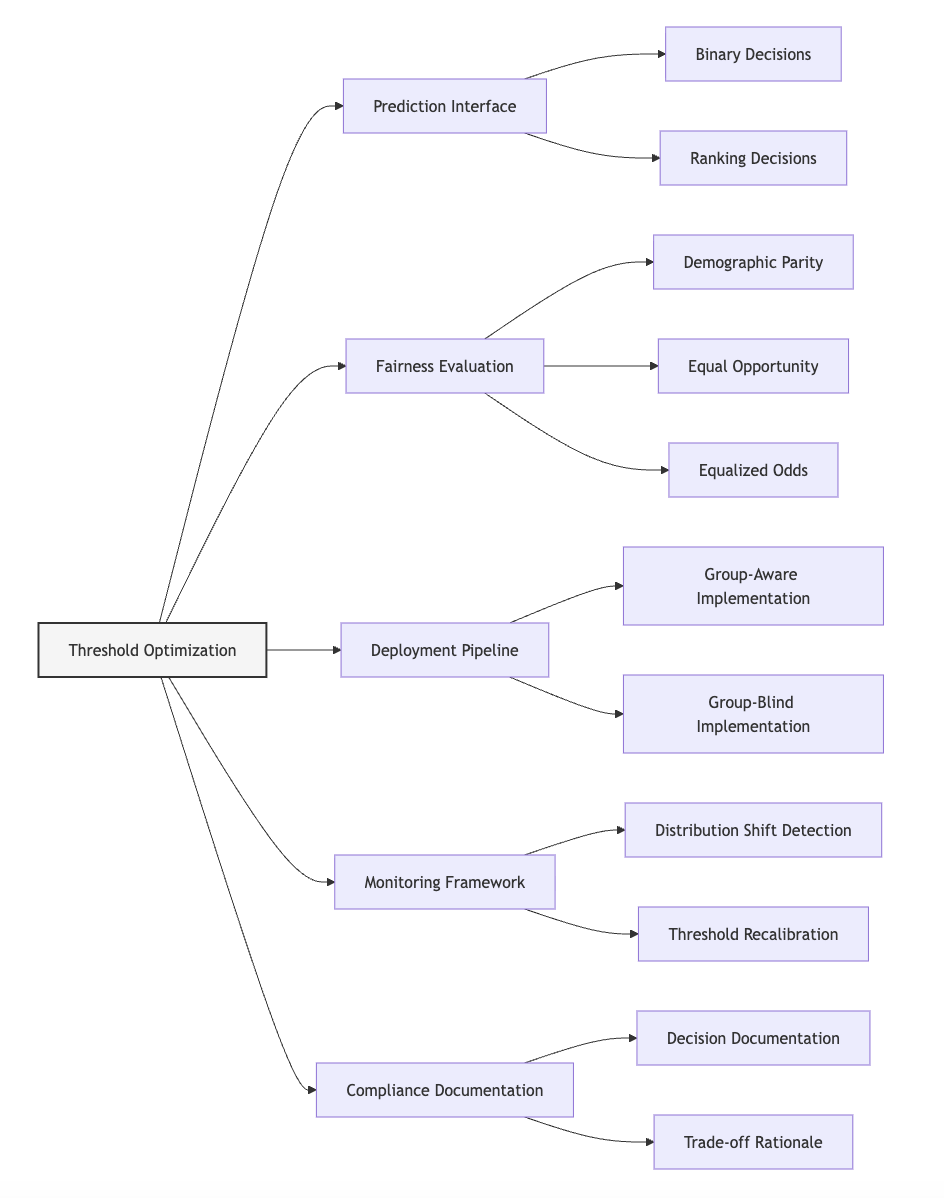
Threshold optimization connects to specific components of ML systems:
- Prediction Interface: Thresholds determine how continuous model outputs translate into discrete decisions that affect users.
- Fairness Evaluation: Different threshold choices directly impact fairness metrics like demographic parity, equal opportunity, and equalized odds.
- Deployment Pipeline: Threshold implementations must integrate with production systems, potentially alongside other fairness interventions.
- Monitoring Framework: Thresholds may require adjustment over time as data distributions change.
- Compliance Documentation: Threshold choices should be documented with clear rationales for audit and transparency purposes.
This domain mapping helps you understand how threshold optimization fits within your broader ML system architecture. Unlike interventions that modify data or models, threshold adjustments operate at the prediction interface, making them particularly suitable for integration into existing deployment pipelines.
Conceptual Clarification
To clarify threshold optimization, consider these analogies:
- Threshold optimization is like adjusting the qualifying standards for different tracks in a high school based on resource disparities. A school with well-funded and under-resourced tracks might set different qualifying times for a state competition to ensure students from both tracks have equal opportunity to qualify, recognizing that the same standard applied to uneven preparation conditions would perpetuate existing advantages. Similarly, group-specific thresholds adjust decision boundaries to account for historical disparities and different error patterns across groups.
- The fairness-performance trade-off in threshold optimization resembles balancing precision and recall in search engine design. Just as search engineers must decide whether to show more results (higher recall but lower precision) or fewer, more relevant results (higher precision but lower recall), fairness practitioners must navigate trade-offs between different error types across groups. No single operating point optimizes all metrics simultaneously, forcing explicit choices based on application priorities.
- Group-specific thresholds without protected attributes function like progressive taxation without requiring individual income disclosure. Just as tax systems can implement income-sensitive policies through bracket structures that apply to everyone (but affect different income groups differently), threshold systems can implement multiple decision boundaries that effectively address group disparities without explicitly identifying group membership at decision time.
Intersectionality Consideration
Traditional threshold optimization approaches often address protected attributes independently, potentially missing unique fairness concerns at intersections of multiple identities. As Buolamwini and Gebru (2018) demonstrated in their "Gender Shades" research, models may perform adequately when evaluated on single attributes (e.g., gender or race separately) while showing significant disparities at intersections (e.g., specific combinations of gender and race).
Applying threshold optimization to address intersectional fairness requires:
- Multi-dimensional threshold spaces that consider all relevant demographic combinations rather than optimizing for each protected attribute separately.
- Statistical techniques for smaller groups since intersectional categories often have limited samples, creating challenges for reliable threshold estimation.
- Prioritization frameworks for determining which intersectional disparities most urgently require threshold adjustment based on both statistical significance and ethical considerations.
- Monitoring approaches that track how threshold adjustments affect all demographic intersections, not just the main groups.
For example, a facial recognition system might show different error patterns for young Black women compared to either young women overall or Black people overall. Addressing this requires threshold optimization that explicitly considers these intersectional categories rather than adjusting thresholds based solely on gender or race independently.
The Post-processing Calibration Guide you'll develop must incorporate these intersectional considerations to ensure that threshold optimizations improve fairness across all demographic subgroups rather than simply addressing disparities between main groups while leaving intersectional concerns unaddressed.
3. Practical Considerations
Implementation Framework
To effectively implement threshold optimization for fairness, follow this structured methodology:
-
Fairness Criteria Selection:
-
Determine which fairness definition (demographic parity, equal opportunity, equalized odds) is most appropriate for your application context.
- Establish whether you need to optimize for a single fairness metric or balance multiple criteria.
-
Document your selection rationale, considering both ethical principles and practical constraints.
-
Threshold Calculation:
-
For demographic parity: Find thresholds that equalize selection rates across groups.
- For equal opportunity: Identify thresholds that equalize true positive rates.
- For equalized odds: Calculate thresholds that equalize both true positive and false positive rates (may require randomization between two thresholds for some groups).
-
Implement these calculations using validation data separate from both training and test sets.
-
Trade-off Analysis:
-
Quantify how different threshold choices affect both fairness metrics and performance measures.
- Generate the fairness-performance Pareto frontier showing all efficient operating points.
- Select final thresholds based on explicit prioritization of competing objectives.
-
Document the trade-offs inherent in your selected thresholds for transparency.
-
Deployment Strategy:
-
Determine whether protected attributes can be used at decision time in your application.
- If available, implement direct group-specific thresholds.
- If unavailable, develop proxy approaches or multiple threshold schemes that approximate group-fairness properties without explicit group identification.
- Create clear implementation documentation for integration into production systems.
This methodology integrates with standard ML workflows by operating after model training is complete, making it compatible with existing deployment pipelines. While introducing some additional complexity in decision logic, it requires minimal changes to upstream model development processes.
Implementation Challenges
When implementing threshold optimization, practitioners commonly face these challenges:
-
Legal and Ethical Constraints: Many jurisdictions limit the use of protected attributes in decision-making, even for bias mitigation. Address this by:
-
Consulting legal expertise to determine what's permissible in your specific context.
- Developing implementations that approximate group-specific thresholds without requiring protected attributes at decision time.
- Creating clear documentation of fairness justifications for any use of protected attributes.
-
Exploring alternative fairness interventions when threshold optimization faces insurmountable legal barriers.
-
Threshold Stability: Thresholds optimized on validation data may perform differently on production data due to distribution shifts. Address this by:
-
Implementing robust cross-validation approaches to estimate threshold stability.
- Establishing monitoring systems that detect when threshold adjustments no longer achieve intended fairness improvements.
- Developing procedures for periodic threshold recalibration based on recent production data.
- Building confidence intervals around threshold estimates to account for statistical uncertainty.
Successfully implementing threshold optimization requires resources including validation data with reliable protected attribute information, statistical expertise for threshold calculation and evaluation, and monitoring infrastructure for ongoing fairness assessment. The resource requirements are generally lower than for pre-processing or in-processing approaches since you don't need to modify or retrain models.
Evaluation Approach
To assess whether your threshold optimization effectively improves fairness, implement these evaluation strategies:
-
Fairness Metrics Evaluation:
-
Measure the target fairness metrics (e.g., demographic parity difference, equal opportunity difference) before and after threshold adjustment.
- Calculate confidence intervals around these metrics to assess statistical significance of improvements.
- Evaluate fairness across intersectional demographic categories, not just main groups.
-
Verify that threshold adjustments improve fairness metrics on held-out test data, not just validation data.
-
Performance Impact Assessment:
-
Quantify changes in overall accuracy, precision, recall, F1-score, or application-specific utility metrics after threshold adjustment.
- Evaluate performance changes for each demographic group separately to ensure no group experiences unacceptable performance degradation.
- Calculate the efficiency of your threshold adjustments by measuring fairness improvement per unit of performance reduction.
- Compare with alternative fairness interventions (pre-processing, in-processing) to determine relative efficiency.
These evaluation approaches should be integrated with your organization's broader fairness assessment framework, providing quantitative measures of both fairness improvements and performance impacts resulting from threshold adjustments.
4. Case Study: Loan Application System
Scenario Context
A financial institution has deployed a machine learning model to predict default risk for loan applications. The model produces a probability score between 0 and 1, with higher scores indicating higher predicted default risk. Loan applications are rejected when this score exceeds a threshold, originally set at 0.5 for all applicants.
Initial fairness analysis revealed significant disparities: the model shows a true positive rate (correctly identifying non-defaulting applicants) of 85% for one racial group but only 70% for another, despite similar actual default rates. This disparity could unfairly deny loans to qualified applicants from the disadvantaged group.
Multiple stakeholders are involved: risk management teams concerned with maintaining accurate default prediction, regulatory compliance officers monitoring fair lending requirements, and business leaders balancing growth with risk management. The Equal Credit Opportunity Act explicitly prohibits discrimination in lending, creating clear legal requirements for fairness.
The team decided to explore threshold optimization as a potential solution since retraining the model would require months of development and validation, while threshold adjustments could be implemented quickly without disrupting existing systems.
Problem Analysis
Applying threshold optimization concepts to this scenario reveals several key insights:
- Fairness Definition Analysis: Since the primary concern involves qualified applicants (non-defaulters) being incorrectly rejected, equal opportunity emerges as the most appropriate fairness definition. This aligns with both ethical principles of fair access to credit and regulatory requirements that prohibit disparate impact on protected groups.
- ROC Analysis: Examining the ROC curves for each racial group shows that the same threshold (0.5) produces different true positive and false positive rates across groups. This occurs because the probability distributions differ between groups—likely reflecting historical discrimination patterns in lending data that affected model training.
- Trade-off Evaluation: Computing the fairness-performance Pareto frontier reveals that perfect equality in true positive rates would require setting the threshold at 0.65 for the advantaged group and 0.45 for the disadvantaged group. This adjustment would reduce the bank's overall profit by approximately 3% due to both additional defaults and missed lending opportunities, though it would improve fairness significantly.
- Implementation Constraint Assessment: Legal counsel advised that explicitly using race in lending decisions—even for bias mitigation—could violate regulatory guidelines. This constrained the implementation options for threshold optimization, requiring approaches that achieve fairness improvements without direct access to protected attributes at decision time.
From an intersectional perspective, the analysis revealed that the disparity was particularly pronounced for younger applicants within the disadvantaged racial group, with true positive rates as low as 60% for this intersection. This highlighted the need for threshold approaches that address intersectional concerns, not just disparities between main racial groups.
Solution Implementation
To address these fairness issues through threshold optimization, the team implemented a structured approach:
-
Equal Opportunity Threshold Calculation:
-
They calculated group-specific thresholds on a validation dataset containing protected attributes: 0.65 for the advantaged group and 0.45 for the disadvantaged group.
- These thresholds equalized the true positive rate across racial groups at approximately 80%, representing a compromise between the original 85% and 70% rates.
-
Statistical validation confirmed that these thresholds significantly reduced the disparity without introducing new fairness issues.
-
Proxy-Based Implementation:
-
Since direct use of race for threshold adjustment raised regulatory concerns, they implemented a proxy-based approach.
- They identified legally permissible application features that correlated with group membership and trained a small threshold selection model using these features.
-
This model effectively assigned appropriate thresholds without explicitly using protected attributes at decision time, achieving approximately 90% of the fairness benefit of the direct approach.
-
Intersectional Consideration:
-
For the younger subgroup within the disadvantaged racial group, they identified an adjusted threshold that specifically addressed the more severe disparity faced by this intersection.
-
The proxy model incorporated age as a legally permissible feature, allowing it to partially address this intersectional concern without directly using race.
-
Monitoring Framework:
-
They established ongoing monitoring of true positive rates across all demographic groups and intersections.
- The system included alerts for when disparities exceeded predefined thresholds, triggering review and potential threshold recalibration.
- Quarterly compliance reviews assessed both fairness metrics and business impact of the threshold adjustments.
Throughout implementation, they maintained detailed documentation of the fairness rationale for each threshold adjustment, creating an audit trail for both internal governance and potential regulatory review.
Outcomes and Lessons
The threshold optimization approach yielded several key results:
- The equal opportunity disparity between racial groups decreased by 80%, from a 15 percentage point gap to approximately 3 points.
- The proxy-based implementation successfully approximated the fairness benefits of direct group-specific thresholds while maintaining regulatory compliance.
- The overall financial impact was less than initially projected—a 1.8% reduction in profit rather than 3%—because the increased lending to qualified applicants in the disadvantaged group partially offset losses from threshold adjustments.
- The most severe intersectional disparities saw improvement, though not complete resolution, suggesting that threshold optimization alone might be insufficient for addressing complex intersectional fairness issues.
The implementation also revealed important challenges and lessons:
- The proxy-based approach required careful legal review to ensure it didn't create "disparate treatment by proxy" concerns.
- Initial threshold settings required adjustment after two months due to seasonal variations in applicant distributions, highlighting the need for ongoing monitoring and recalibration.
- Communicating the fairness-performance trade-offs to business stakeholders proved challenging, requiring concrete dollar figures rather than abstract statistical metrics.
These insights directly inform the Post-processing Calibration Guide by highlighting both the power and limitations of threshold optimization. While it provided rapid fairness improvements without model retraining, addressing complex intersectional disparities ultimately required combining threshold optimization with longer-term data collection and model improvement initiatives.
5. Frequently Asked Questions
FAQ 1: Group-Specific Thresholds Vs. Single Threshold
Q: Doesn't using different thresholds for different groups violate the principle of treating everyone equally? How do we justify this approach ethically and legally?
A: This question touches on the fundamental distinction between procedural fairness (equal treatment) and outcome fairness (equal impact). Using a single threshold appears procedurally fair because everyone faces the same decision rule, but it often produces unfair outcomes when underlying score distributions differ across groups due to historical biases or measurement disparities. Group-specific thresholds adjust the decision boundary to account for these systematic differences, ultimately creating more equitable outcomes. Legally, many anti-discrimination frameworks recognize this distinction through concepts like "disparate impact" in US law, which focuses on discriminatory effects regardless of intent. Several legal precedents support adjustments that reduce discriminatory impact, provided they're well-justified and narrowly tailored to that purpose. The key to ethical and legal justification lies in documenting: (1) evidence of existing disparities under a single threshold, (2) how these disparities connect to historical discrimination patterns, (3) that your threshold adjustments specifically target these disparities, and (4) that you've considered alternatives and found threshold optimization to be the most appropriate solution. This documented reasoning provides both ethical justification and potential legal defense if your approach is questioned.
FAQ 2: Threshold Optimization Without Protected Attributes
Q: How can we implement threshold optimization when we don't have access to protected attributes during deployment, or when using such attributes would violate regulations?
A: You can implement threshold optimization without protected attributes at decision time through several approaches: First, consider a "derived features" strategy where you develop a threshold selection model trained on validation data with protected attributes but deployed using only permissible features that correlate with group membership. This model effectively learns to assign appropriate thresholds without explicitly using protected attributes. Second, implement a "multiple threshold scheme" where you apply several different thresholds to all individuals based on score ranges, carefully designed to approximate group-fairness properties without group identification. For example, using higher thresholds for high-scoring individuals and lower thresholds for borderline cases often improves fairness metrics even without group labels. Third, explore "adversarially fair representations" that transform prediction scores to remove correlations with protected attributes while preserving legitimate risk information. Whichever approach you choose, verify its effectiveness through counterfactual analysis on validation data with protected attributes, and document your methodology carefully to demonstrate good-faith fairness efforts despite constraints. Remember that these techniques typically achieve 70-90% of the fairness benefit of direct group-specific thresholds, representing significant improvement even when protected attributes cannot be used directly.
6. Project Component Development
Component Description
In Unit 5, you will develop the threshold optimization section of the Post-processing Calibration Guide. This component will provide a structured methodology for selecting, calculating, and implementing optimal thresholds to satisfy specific fairness criteria across demographic groups.
The deliverable will include mathematical formulations, implementation algorithms, evaluation methodologies, and decision frameworks for determining when threshold optimization is the most appropriate fairness intervention.
Development Steps
- Develop a Fairness-Specific Threshold Calculation Framework: Create step-by-step procedures for calculating optimal thresholds for different fairness definitions (demographic parity, equal opportunity, equalized odds). Include both analytical approaches for simple cases and numerical optimization methods for complex scenarios.
- Design a Comprehensive Trade-off Analysis Approach: Build methodologies for explicitly quantifying the trade-offs between fairness improvements and performance impacts. Include visualization templates, Pareto frontier calculation algorithms, and decision frameworks for selecting operating points based on application priorities.
- Create Implementation Patterns for Different Constraints: Develop implementation algorithms for both scenarios where protected attributes are available at decision time and those where they aren't. Include proxy-based approaches, multiple threshold schemes, and guidance for selecting between them based on legal and operational constraints.
Integration Approach
This threshold optimization component will interface with other parts of the Post-processing Calibration Guide by:
- Building on the calibration approaches from Unit 2, which ensure predicted probabilities have consistent meaning before threshold adjustment.
- Establishing foundations for the more general transformation methods in Unit 3, which extend beyond simple thresholds to more complex modifications.
- Creating decision frameworks that help determine when threshold optimization is preferable to other post-processing techniques like calibration or rejection classification.
To enable successful integration, use consistent mathematical notation across components, clearly document assumptions and dependencies, and establish standard evaluation metrics that apply across different post-processing techniques.
7. Summary and Next Steps
Key Takeaways
This Unit has equipped you with a comprehensive understanding of threshold optimization for fairness. Key insights include:
- Threshold adjustment power: You've learned how simply changing decision thresholds after training can significantly improve fairness metrics without requiring model modification or retraining, making it one of the most accessible and flexible fairness interventions.
- Mathematical foundations: You now understand the precise mathematical relationships between threshold selection and fairness metrics like demographic parity, equal opportunity, and equalized odds, enabling you to target specific fairness definitions through appropriate threshold adjustments.
- Trade-off navigation: You've developed frameworks for explicitly quantifying and navigating the inevitable trade-offs between fairness improvements and performance impacts, allowing for principled decisions rather than arbitrary adjustments.
- Implementation variations: You've explored approaches for implementing threshold optimization both with and without access to protected attributes at decision time, providing solutions for different regulatory and operational constraints.
These concepts directly address our guiding questions by showing how threshold adjustments can satisfy specific fairness definitions without retraining, while providing frameworks for navigating the mathematical relationships and trade-offs between different fairness and performance metrics.
Application Guidance
To apply threshold optimization in your practical work:
- Begin by determining which fairness definition (demographic parity, equal opportunity, equalized odds) best aligns with your application's ethical requirements and regulatory context.
- Generate ROC curves for each demographic group to visualize how different thresholds affect error rates across groups and identify potential operating points.
- Calculate group-specific thresholds that satisfy your selected fairness criteria, and quantify the resulting fairness improvements and performance impacts.
- Assess whether your application allows for the use of protected attributes at decision time, and implement either direct group-specific thresholds or proxy approaches based on this constraint.
For organizations new to fairness interventions, threshold optimization offers an excellent starting point due to its simplicity, flexibility, and minimal disruption to existing systems. Even if you eventually implement more sophisticated fairness approaches, threshold optimization provides immediate improvements while more complex interventions are developed.
Looking Ahead
In the next Unit, we will build on threshold optimization by exploring calibration across groups. While threshold optimization adjusts decision boundaries to equalize error rates, calibration ensures that the underlying probability estimates have consistent meaning across demographic groups. This complementary approach addresses a different aspect of fairness—the interpretation of model confidence rather than just binary decisions.
The threshold optimization techniques you've learned here provide a foundation for understanding how post-processing interventions can improve fairness. Calibration will extend this foundation by addressing the probability values themselves rather than just the thresholds applied to them, creating more comprehensive fairness improvements across both binary decisions and confidence scores.
References
Buolamwini, J., & Gebru, T. (2018). Gender shades: Intersectional accuracy disparities in commercial gender classification. In Proceedings of the 1st Conference on Fairness, Accountability, and Transparency (pp. 77–91).
Corbett-Davies, S., Pierson, E., Feller, A., Goel, S., & Huq, A. (2017). Algorithmic decision making and the cost of fairness. In Proceedings of the 23rd ACM SIGKDD International Conference on Knowledge Discovery and Data Mining (pp. 797–806).
Dwork, C., Immorlica, N., Kalai, A. T., & Leiserson, M. D. (2018). Decoupled classifiers for group-fair and efficient machine learning. In Proceedings of the 1st Conference on Fairness, Accountability, and Transparency (pp. 119–133).
Friedler, S. A., Scheidegger, C., Venkatasubramanian, S., Choudhary, S., Hamilton, E. P., & Roth, D. (2019). A comparative study of fairness-enhancing interventions in machine learning. In Proceedings of the Conference on Fairness, Accountability, and Transparency (pp. 329–338).
Hardt, M., Price, E., & Srebro, N. (2016). Equality of opportunity in supervised learning. In Advances in Neural Information Processing Systems (pp. 3315–3323).
Kleinberg, J., Mullainathan, S., & Raghavan, M. (2016). Inherent trade-offs in the fair determination of risk scores. In Proceedings of the 8th Innovations in Theoretical Computer Science Conference (pp. 43:1–43:23).
Lipton, Z. C., Wang, Y. X., & Smola, A. (2018). Detecting and correcting for label shift with black box predictors. In Proceedings of the 35th International Conference on Machine Learning (pp. 3128–3136).
Unit 2
Unit 2: Calibration Across Groups
1. Conceptual Foundation and Relevance
Guiding Questions
- Question 1: How do we ensure predicted probabilities convey consistent meaning across demographic groups?
- Question 2: How can we address calibration disparities without sacrificing other fairness properties?
Conceptual Context
When models produce probability scores, those scores should mean the same thing regardless of who receives them. A 70% probability of default should represent the same risk whether the applicant is young or old, male or female. Yet many seemingly accurate models produce miscalibrated probabilities across demographic groups, creating a subtle but pernicious form of algorithmic unfairness.
This calibration problem matters because probability scores drive high-stakes decisions in lending, healthcare, criminal justice, and hiring. When a model assigns a 70% risk to one demographic group but that risk actually represents an 85% likelihood, while accurately assessing another group's 70% risk, it creates fundamentally unfair treatment that's invisible to standard accuracy metrics. As Pleiss et al. (2017) demonstrated, models with identical accuracy can exhibit substantial calibration disparities across groups, requiring specific interventions to ensure consistent interpretation.
This Unit builds directly upon the threshold optimization techniques from Unit 1, which focused on adjusting decision boundaries to achieve fairness. While threshold adjustments address binary decisions, calibration addresses the underlying probability estimates themselves. The calibration techniques you'll learn here will directly inform the Post-processing Calibration Guide you'll develop in Unit 5, providing methodology for ensuring probability outputs have consistent meaning across all demographic groups.
2. Key Concepts
Calibration as a Fairness Criterion
Calibration refers to the alignment between predicted probabilities and observed outcomes. A perfectly calibrated model ensures that among all instances assigned a predicted probability of p%, exactly p% actually belong to the positive class. This concept forms a distinct fairness criterion that differs from error rate parity or demographic parity, focusing instead on the reliability of probability estimates across groups.
Calibration connects directly to fairness because miscalibrated predictions across demographic groups create inconsistent treatment, even when decision thresholds remain constant. It interacts with other fairness concepts by introducing a different dimension of equity—one focused on the interpretation of model outputs rather than just the decisions derived from them.
As Kleinberg, Mullainathan, and Raghavan (2016) demonstrated in their seminal work, calibration represents one of three core fairness properties (alongside balance for the positive and negative classes) that cannot be simultaneously satisfied in most real-world scenarios. This "impossibility theorem" proved that perfect calibration typically conflicts with equal false positive and false negative rates across groups when base rates differ, forcing practitioners to prioritize which fairness properties matter most in specific contexts.
The practical implication is significant: a lending model might accurately predict default rates for different demographic groups in aggregate, but systematically underestimate risk for some applicants while overestimating it for others. Even with identical decision thresholds, this miscalibration creates fundamentally unequal treatment because the same score means different things for different people.
For the Post-processing Calibration Guide you'll develop in Unit 5, understanding calibration as a distinct fairness criterion will help you guide practitioners in determining when to prioritize calibration over other fairness properties and how to navigate the inevitable trade-offs that arise.
Group-Specific Calibration Techniques
Multiple technical approaches exist for achieving calibration across demographic groups, each with distinct strengths and implementation considerations. This concept is central to AI fairness because it provides the practical methodology for addressing miscalibration after a model has been trained.
Group-specific calibration builds on the understanding that miscalibration patterns often differ across demographic groups. It interacts with threshold optimization from Unit 1 by providing adjusted probability scores that can then be used with optimized thresholds for comprehensive fairness improvements.
Several established techniques address group calibration:
- Platt Scaling: This approach fits a logistic regression model to transform raw model outputs into calibrated probabilities. For group-specific calibration, separate logistic models are trained for each demographic group. As shown by Platt (1999) and adapted for fairness by Pleiss et al. (2017), this simple approach effectively addresses many calibration disparities.
- Isotonic Regression: This non-parametric technique fits a piecewise constant function that transforms raw scores into calibrated probabilities while maintaining rank order. Zadrozny and Elkan (2002) demonstrated its effectiveness for general calibration, while later fairness research applied it to group-specific calibration.
- Beta Calibration: This approach uses a parametric beta distribution to model the relationship between predictions and outcomes, offering advantages for naturally bounded probability estimates. Kull, Silva Filho, and Flach (2017) showed its effectiveness for calibrating probabilistic classifiers.
- Temperature Scaling: A simple but effective technique that divides logits by a single parameter (temperature) before applying the softmax function. Guo et al. (2017) demonstrated its effectiveness for neural network calibration, and it can be applied separately for each demographic group.
For the Post-processing Calibration Guide, these techniques provide the core methodology for implementing calibration across groups. Understanding their relative strengths helps practitioners select appropriate approaches based on their specific model types and data characteristics.
Calibration Evaluation Metrics
Proper evaluation of calibration requires specialized metrics that differ from standard accuracy measures. This concept is crucial for AI fairness because it enables quantitative assessment of calibration disparities and the effectiveness of calibration interventions.
Calibration evaluation connects to the other fairness metrics explored in previous Units by providing complementary measures focused specifically on probability reliability. It interacts with the implementation techniques by enabling comparative assessment of different calibration approaches.
Key calibration metrics include:
- Expected Calibration Error (ECE): This metric measures the difference between predicted probabilities and actual frequencies, calculated by dividing predictions into bins and computing a weighted average of the absolute difference between average predicted probability and observed frequency in each bin. Lower values indicate better calibration. Naeini, Cooper, and Hauskrecht (2015) formalized this widely-used metric.
- Maximum Calibration Error (MCE): Similar to ECE but focuses on the worst-case scenario by measuring the maximum calibration error across all bins. This metric highlights the most severe calibration issues.
- Reliability Diagrams: These visual tools plot predicted probabilities against observed frequencies, allowing visual assessment of calibration. A perfectly calibrated model would show points along the diagonal line. Kumar, Liang, and Ma (2019) demonstrated their utility for identifying specific regions of miscalibration.
- Group-Specific Calibration Metrics: For fairness applications, these standard metrics should be calculated separately for each demographic group, with significant disparities indicating calibration-based unfairness.
For the Post-processing Calibration Guide, these evaluation metrics provide essential tools for both identifying calibration disparities and assessing intervention effectiveness. They enable practitioners to quantify the calibration dimension of fairness and track improvements from specific interventions.
The Calibration-Fairness Trade-off
A fundamental tension exists between calibration and other fairness criteria, creating unavoidable trade-offs in most real-world scenarios. This concept is essential for AI fairness because it helps practitioners understand what's mathematically possible and make principled choices among competing fairness properties.
The calibration-fairness trade-off builds directly on the impossibility results established by Kleinberg et al. (2016), which proved that calibration, balance for the positive class, and balance for the negative class cannot be simultaneously satisfied except in degenerate cases. This creates a three-way trade-off between calibration and traditional fairness criteria like equal false positive rates.
Practical implications of this trade-off include:
- Decision Context Prioritization: In some settings (like risk assessment), calibration may be more important than equal error rates, while in others (like hiring), error rate parity might take precedence.
- Partial Satisfaction Approaches: Rather than perfect satisfaction of any criterion, practitioners often seek to minimize disparities across multiple fairness dimensions simultaneously.
- Stakeholder Communication: These mathematical impossibilities require clear explanation to non-technical stakeholders who might reasonably expect all fairness criteria to be satisfiable.
As Corbett-Davies and Goel (2018) argue in their analysis of risk assessment instruments, calibration often represents the most appropriate fairness criterion in contexts where probabilistic risk estimates directly inform decisions. Their work demonstrates that enforcing error rate parity can paradoxically harm the very groups it aims to protect when it comes at the expense of calibration.
For the Post-processing Calibration Guide, understanding these trade-offs is essential for helping practitioners make informed choices when perfect satisfaction of all criteria is mathematically impossible. The guide must provide clear decision frameworks for determining when to prioritize calibration over other fairness properties based on application context.
Domain Modeling Perspective
From a domain modeling perspective, calibration across groups maps to specific components of ML systems:
- Probability Calibration Layer: A post-processing component that transforms raw model outputs into calibrated probabilities.
- Group-Specific Transformation Functions: Separate calibration mappings for each demographic group.
- Calibration Dataset Management: A data component that maintains a holdout set for fitting calibration transformations.
- Calibration Evaluation Module: A system component that measures and monitors calibration quality across groups.
- Fairness Trade-off Manager: A governance component that navigates tensions between calibration and other fairness criteria.
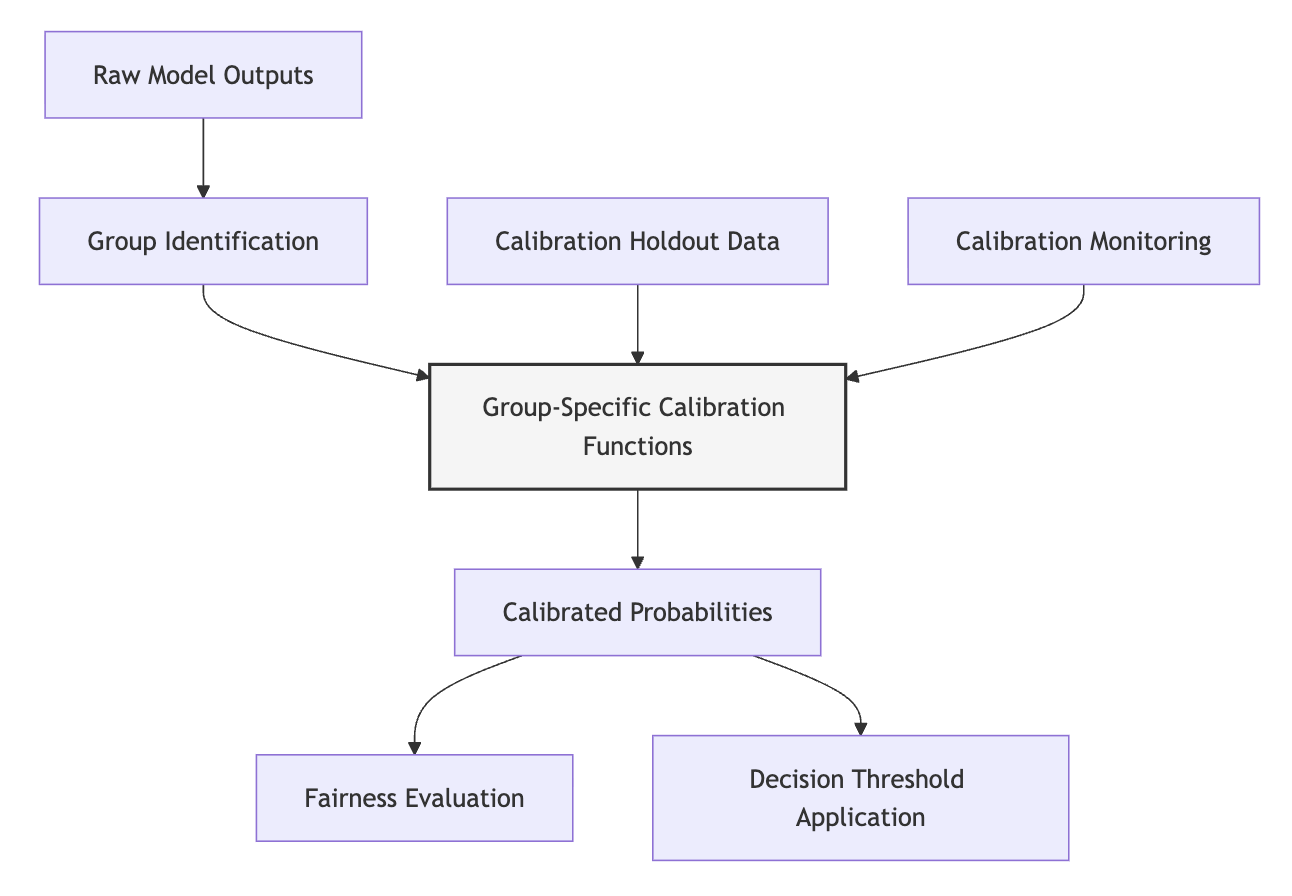
This domain mapping helps you understand how calibration components integrate with the broader ML system rather than viewing them as isolated statistical adjustments. The Post-processing Calibration Guide will leverage this mapping to design interventions that fit within existing system architectures.
Conceptual Clarification
To clarify these abstract calibration concepts, consider the following analogies:
- Miscalibration across groups resembles inconsistent grading standards across different classrooms. Imagine two teachers giving the same letter grade "B" for significantly different levels of performance. A "B" from the strict teacher might represent mastery of 85% of the material, while a "B" from the lenient teacher might represent only 75% mastery. Similarly, a model that outputs a 70% risk score for different demographic groups might actually represent an 85% risk for one group and a true 70% risk for another—creating fundamental unfairness in how the same score is interpreted.
- Calibration techniques function like standardized grading curves that ensure consistent interpretation. Just as schools might adjust raw scores from different teachers to ensure a "B" represents the same level of achievement regardless of who assigned it, calibration techniques transform raw model outputs to ensure a 70% probability means the same thing regardless of which demographic group receives it.
- The calibration-fairness trade-off operates like balancing different principles of justice in a legal system. A legal system might value both consistent punishment for the same crime (similar to calibration) and equal rates of false conviction across groups (similar to error rate parity). When these principles conflict, the system must prioritize based on context rather than assuming both can be perfectly satisfied simultaneously.
3. Practical Considerations
Implementation Framework
To effectively implement calibration across demographic groups, follow this structured methodology:
-
Calibration Assessment:
-
Compute calibration metrics (ECE, MCE) separately for each demographic group.
- Create reliability diagrams showing calibration patterns for each group.
- Quantify disparities in calibration metrics to determine intervention necessity.
-
Document baseline calibration assessment before intervention.
-
Calibration Method Selection:
-
For parametric models with moderate miscalibration, implement Platt scaling with separate parameters for each group.
- For flexible, non-parametric calibration, apply isotonic regression individually to each group.
- For neural networks with systematic miscalibration, consider temperature scaling per group.
-
For complex miscalibration patterns, implement histogram binning or more sophisticated approaches.
-
Implementation Process:
-
Split data into training, calibration, and test sets to prevent leakage.
- Fit calibration transformations using the dedicated calibration dataset.
- Apply group-specific transformations to model outputs before making decisions.
-
Implement proper handling for previously unseen groups or edge cases.
-
Calibration Validation:
-
Evaluate post-calibration metrics on held-out test data.
- Compare calibration improvements against potential impacts on other fairness criteria.
- Verify that rank ordering within groups is preserved when needed.
- Document calibration outcomes across all demographic intersections.
These methodologies integrate with standard ML workflows by adding a post-processing step between model prediction and decision-making. While they add implementation complexity, they enable fairer interpretation of model outputs without requiring retraining.
Implementation Challenges
When implementing calibration across groups, practitioners commonly face these challenges:
-
Limited Samples for Minority Groups: Some demographic groups may have too few examples for reliable calibration curve fitting. Address this by:
-
Applying Bayesian calibration approaches that incorporate prior knowledge.
- Using smoothing techniques or regularization to prevent overfitting.
- Borrowing statistical strength across related groups when appropriate.
-
Clearly documenting uncertainty in calibration for groups with limited samples.
-
Deployment Complexities: Maintaining separate calibration curves for each group creates operational challenges. Address this by:
-
Implementing efficient lookup systems that apply the appropriate calibration transformation based on group membership.
- Creating fallback strategies for handling individuals with unknown or multiple group memberships.
- Developing monitoring systems that detect calibration drift over time.
- Establishing processes for periodic recalibration as data distributions evolve.
Successfully implementing calibration requires resources including a dedicated calibration dataset, computational infrastructure for group-specific transformations, and monitoring systems to track calibration quality over time. Organizations must also establish policies for determining which demographic dimensions require calibration and how to navigate the trade-offs with other fairness properties.
Evaluation Approach
To assess whether your calibration interventions are effective, implement these evaluation strategies:
-
Calibration Quality Assessment:
-
Calculate pre-intervention and post-intervention ECE and MCE for each group.
- Create reliability diagrams showing calibration improvements.
- Compute statistical significance of calibration changes.
-
Assess calibration across different probability ranges.
-
Trade-off Analysis:
-
Measure how calibration improvements affect other fairness metrics.
- Quantify changes in threshold-based fairness criteria after calibration.
- Evaluate the overall fairness-performance Pareto frontier.
- Document which fairness properties improved or degraded.
These evaluation approaches should be integrated with your organization's broader fairness assessment framework, providing a comprehensive view of how calibration interventions affect multiple fairness dimensions.
4. Case Study: Recidivism Risk Assessment
Scenario Context
A criminal justice agency uses a machine learning model to predict recidivism risk, helping judges make informed decisions about pretrial release, sentencing, and parole. The model produces probability scores indicating the likelihood of reoffending within two years, with higher scores suggesting greater risk. Initial fairness assessment revealed significant accuracy disparities across racial groups, prompting closer examination of model outputs.
This scenario involves critical fairness considerations because risk scores directly impact individuals' liberty and potentially reinforce historical patterns of discrimination in the criminal justice system. Stakeholders include judges who rely on these predictions, defendants whose freedom may depend on them, communities concerned about both public safety and equal treatment, and agency officials responsible for system fairness.
Problem Analysis
Applying calibration analysis revealed a critical fairness issue not captured by standard accuracy metrics:
- Group-Specific Calibration Disparities: While the model achieved similar overall accuracy across racial groups, reliability diagrams showed systematic miscalibration patterns. For Black defendants, the model consistently underestimated recidivism risk by 5-10 percentage points across most of the probability range. For Hispanic defendants, it overestimated risk by 7-12 percentage points, especially in the critical middle range (40-60%) where many decision thresholds are set.
- Interpretation Inconsistency: This meant that a Hispanic defendant receiving a 60% risk score actually represented about a 50% true risk, while a Black defendant with a 50% score represented closer to 58% true risk. Despite having the same decision threshold for all groups, these miscalibration patterns created fundamentally unfair treatment because the same score meant substantively different things depending on the defendant's race.
- Decision Impact Analysis: Further analysis revealed that these calibration disparities led to disproportionate outcomes. Hispanic defendants faced excessive detention due to overestimated risk, while Black defendants with higher actual risk were sometimes incorrectly released, potentially leading to both unfair confinement and public safety concerns.
The calibration disparities persisted even after trying initial threshold adjustments from Unit 1, demonstrating that decision boundary optimization alone was insufficient to address these interpretation inconsistencies.
From an intersectional perspective, the analysis revealed even more pronounced calibration issues for young Hispanic males and older Black females - groups that would be missed by examining either race, age, or gender separately.
Solution Implementation
To address these calibration disparities, the team implemented a comprehensive approach:
- Calibration Method Selection: After testing multiple approaches, they selected isotonic regression as the primary calibration technique due to its flexibility in handling the non-linear miscalibration patterns observed across different risk ranges. Separate isotonic regression models were fitted for each racial group using a dedicated calibration dataset.
-
Implementation Process:
-
They divided their validation data into a calibration-training set (70%) and a calibration-testing set (30%).
- For each demographic group, they fitted isotonic regression models mapping raw model scores to observed recidivism rates.
- They implemented an efficient lookup system that applied the appropriate transformation based on demographic information.
-
They developed a special handling procedure for individuals belonging to groups with limited representation in the data.
-
Intersectionality Consideration:
-
They extended the calibration approach to consider intersections of race, gender, and age, creating specific calibration curves for key intersectional groups.
-
For intersectional groups with limited samples, they implemented a hierarchical borrowing approach that leveraged information from related groups.
-
Trade-off Navigation:
-
They explicitly documented how calibration improvements affected other fairness metrics, including the modest reduction in demographic parity after calibration.
- They engaged stakeholders to establish that in this context, consistent interpretation of risk scores across groups took priority over perfect equalization of detention rates.
Throughout implementation, they maintained careful documentation of calibration decisions, transformation functions, and performance metrics to ensure transparency and auditability.
Outcomes and Lessons
The calibration intervention resulted in several key improvements:
- Expected Calibration Error dropped from an average of 0.08 to 0.03 across racial groups, with the largest improvements for Hispanic defendants.
- Reliability diagrams showed much more consistent alignment between predicted probabilities and observed frequencies across all groups.
- Decision consistency improved, with risk scores now representing similar actual risk regardless of demographic group.
Key challenges remained, including the moderate tension between perfect calibration and equal detention rates, as well as the need for larger samples to improve calibration for some intersectional groups.
The most generalizable lessons included:
- The importance of examining calibration as a distinct fairness dimension, as models can achieve similar accuracy while exhibiting significant calibration disparities.
- The value of group-specific calibration approaches in addressing interpretation inconsistencies that threshold adjustments alone cannot fix.
- The necessity of making explicit, documented choices about which fairness properties to prioritize when mathematical impossibilities prevent satisfying all criteria simultaneously.
These insights directly inform the Post-processing Calibration Guide, particularly in establishing when calibration should take precedence over other fairness properties and which techniques work best for different miscalibration patterns.
5. Frequently Asked Questions
FAQ 1: Calibration Vs. Other Fairness Metrics
Q: How should I determine whether to prioritize calibration over other fairness criteria like equal false positive rates?
A: This critical decision depends on your application context and the specific ways your model outputs are used. Prioritize calibration when: (1) The raw probability scores themselves drive decisions or are directly presented to users - especially when different thresholds might be applied by different decision-makers; (2) The interpretation consistency of risk scores is ethically paramount, such as in medical prognosis where treatment decisions depend on accurate risk assessment; or (3) Legal or regulatory requirements explicitly mandate calibration across groups. Conversely, prioritize other fairness metrics when: (1) Your system makes binary decisions with fixed thresholds where error type balance matters more than probability interpretation; (2) Historical patterns of discrimination in your domain have created specific error imbalances that must be addressed; or (3) Stakeholders have explicitly prioritized error rate parity over calibration. Document this decision process carefully, acknowledging that in many real-world scenarios, you'll need to balance multiple fairness criteria rather than perfectly satisfying any single one. The mathematical impossibility results proven by Kleinberg et al. (2016) mean this trade-off is unavoidable whenever base rates differ between groups - making explicit, principled prioritization essential.
FAQ 2: Calibration Without Protected Attributes
Q: How can I implement calibration across groups when protected attributes are unavailable during deployment?
A: While having protected attributes available enables the most direct group-specific calibration, you can still improve calibration without them through several approaches: First, consider using proxy variables that correlate with protected attributes but are permissible to use. For example, geography might serve as a legal proxy for demographics in some applications. Second, implement "multiaccuracy" approaches that identify subgroups with calibration issues without explicitly using protected attributes, as proposed by Kim et al. (2019). These methods search for any identifiable subgroups with miscalibration and correct them, indirectly addressing demographic disparities. Third, use distributionally robust optimization techniques during training that improve worst-case calibration across potential subgroups. Finally, consider implementing ensemble approaches that apply multiple calibration transformations and aggregate the results, which can improve overall calibration without group identification. While these approaches typically produce smaller calibration improvements than direct group-specific methods, they represent practical alternatives when protected attributes are unavailable or restricted. Document whatever approach you choose and its limitations, acknowledging that perfect calibration across groups is challenging without group identification.
6. Project Component Development
Component Description
In Unit 5, you will develop the calibration methodology section of the Post-processing Calibration Guide. This component will provide a structured approach for identifying calibration disparities across demographic groups and implementing appropriate calibration techniques based on model characteristics and application requirements.
The deliverable will include calibration assessment methodologies, technique selection frameworks, implementation patterns, and evaluation approaches that ensure probability outputs have consistent meaning across demographic groups.
Development Steps
- Create a Calibration Assessment Framework: Develop an approach for measuring calibration quality across demographic groups, including appropriate metrics, visualization techniques, and statistical tests for identifying significant disparities.
- Design a Calibration Technique Selection Guide: Build a decision framework for selecting appropriate calibration methods based on model type, data characteristics, and miscalibration patterns.
- Develop Implementation Templates: Create reusable implementation patterns for common calibration techniques, including code structures, data management approaches, and edge case handling strategies.
Integration Approach
This calibration component will interface with other parts of the Post-processing Calibration Guide by:
- Building on the threshold optimization techniques from Unit 1, providing calibrated probabilities that can then be used with optimal thresholds.
- Establishing foundations for the prediction transformation methods in Unit 3, which will extend these approaches to more general transformations.
- Creating implementation patterns that will be incorporated into the comprehensive guide in Unit 5.
For successful integration, document how calibration complements rather than replaces threshold optimization, establish clear handoffs between calibration and other post-processing techniques, and create consistent evaluation methodologies across all components.
7. Summary and Next Steps
Key Takeaways
This Unit has established the critical importance of calibration across demographic groups as a distinct fairness dimension. You've learned that calibration ensures probability scores have consistent meaning regardless of group membership, creating fundamental fairness in how model outputs are interpreted. Key concepts include:
- Calibration as a Fairness Criterion: Consistent probability interpretation across groups represents a distinct fairness property that may require specific intervention.
- Group-Specific Calibration Techniques: Practical approaches like Platt scaling, isotonic regression, and temperature scaling can address calibration disparities when applied separately to each demographic group.
- Calibration Evaluation Metrics: Specialized measures like Expected Calibration Error (ECE) and reliability diagrams provide quantitative assessment of calibration quality across groups.
- The Calibration-Fairness Trade-off: Mathematical impossibility results create unavoidable tensions between calibration and other fairness criteria, requiring context-specific prioritization.
These concepts directly address our guiding questions by explaining how to ensure consistent probability interpretation and how to navigate the inevitable trade-offs with other fairness properties.
Application Guidance
To apply these concepts in your practical work:
- Start by systematically measuring calibration quality across demographic groups using the evaluation metrics discussed in this Unit. Generate reliability diagrams to visualize miscalibration patterns.
- Select appropriate calibration techniques based on your model type and the specific miscalibration patterns observed. Implement separate calibration transformations for each demographic group.
- Evaluate how calibration improvements affect other fairness metrics, making explicit, documented choices about which properties to prioritize based on your application context.
- Implement monitoring systems to track calibration quality over time, as data distributions may shift and require recalibration.
For organizations new to these approaches, start with simpler techniques like Platt scaling before advancing to more complex methods. Focus initial efforts on the demographic groups and probability ranges where miscalibration has the greatest impact on decisions.
Looking Ahead
In the next Unit, we will build on this foundation by exploring more general prediction transformation methods that go beyond calibration. While calibration focuses specifically on aligning predicted probabilities with empirical outcomes, Unit 3 will examine broader transformation approaches that can implement various fairness criteria through direct modification of model outputs.
The calibration techniques you've learned here provide an important foundation for these more general transformations. By understanding how to adjust probabilities to ensure consistent interpretation, you're now prepared to learn more flexible approaches that can satisfy multiple fairness criteria simultaneously through learned transformations.
References
Corbett-Davies, S., & Goel, S. (2018). The measure and mismeasure of fairness: A critical review of fair machine learning. arXiv preprint arXiv:1808.00023.
Guo, C., Pleiss, G., Sun, Y., & Weinberger, K. Q. (2017). On calibration of modern neural networks. In Proceedings of the 34th International Conference on Machine Learning (pp. 1321-1330).
Kim, M. P., Ghorbani, A., & Zou, J. (2019). Multiaccuracy: Black-box post-processing for fairness in classification. In Proceedings of the 2019 AAAI/ACM Conference on AI, Ethics, and Society (pp. 247-254).
Kleinberg, J., Mullainathan, S., & Raghavan, M. (2016). Inherent trade-offs in the fair determination of risk scores. arXiv preprint arXiv:1609.05807.
Kull, M., Silva Filho, T. M., & Flach, P. (2017). Beta calibration: a well-founded and easily implemented improvement on logistic calibration for binary classifiers. In Artificial Intelligence and Statistics (pp. 623-631).
Kumar, A., Liang, P. S., & Ma, T. (2019). Verified uncertainty calibration. In Advances in Neural Information Processing Systems (pp. 3792-3803).
Naeini, M. P., Cooper, G. F., & Hauskrecht, M. (2015). Obtaining well calibrated probabilities using Bayesian binning. In Proceedings of the AAAI Conference on Artificial Intelligence (Vol. 29, No. 1).
Platt, J. (1999). Probabilistic outputs for support vector machines and comparisons to regularized likelihood methods. Advances in Large Margin Classifiers, 10(3), 61-74.
Pleiss, G., Raghavan, M., Wu, F., Kleinberg, J., & Weinberger, K. Q. (2017). On fairness and calibration. In Advances in Neural Information Processing Systems (pp. 5680-5689).
Zadrozny, B., & Elkan, C. (2002). Transforming classifier scores into accurate multiclass probability estimates. In Proceedings of the 8th ACM SIGKDD International Conference on Knowledge Discovery and Data Mining (pp. 694-699).
Unit 3
Unit 3: Prediction Transformation Methods
1. Conceptual Foundation and Relevance
Guiding Questions
- Question 1: How can we transform model outputs to satisfy fairness constraints while minimizing information loss from the original predictions?
- Question 2: What techniques enable us to implement complex fairness criteria through direct output modifications when we cannot retrain the model or lack access to its internal workings?
Conceptual Context
Prediction transformation methods represent a powerful extension of basic threshold adjustments, offering more flexible and nuanced approaches to post-processing fairness interventions. While threshold optimization (Unit 1) works well for binary decisions and calibration (Unit 2) addresses probability consistency, many fairness scenarios require more sophisticated output transformations that preserve the information content of predictions while satisfying complex fairness criteria.
These methods matter because they enable fairness interventions in scenarios where you cannot modify the training data or model architecture, such as when working with third-party systems, pre-trained models, or legacy deployments. As Dwork et al. (2018) note, prediction transformations "decouple the predictor from the fairness criteria," allowing you to implement fairness requirements without access to the model internals.
This Unit builds directly on the threshold adjustments from Unit 1 and the calibration techniques from Unit 2, extending them to more general transformations with greater flexibility and expressive power. The approaches you learn here will directly inform the Post-processing Calibration Guide you'll develop in Unit 5, particularly for scenarios requiring complex fairness interventions beyond simple threshold shifts or probability recalibration.
2. Key Concepts
Learned Transformation Functions
Unlike simple threshold adjustments or standard calibration techniques that follow predetermined forms, learned transformation functions discover optimal mappings from original predictions to fair outputs based on validation data. This approach enables more flexible interventions that can address complex fairness requirements while preserving predictive information.
Learned transformations interact with threshold optimization by generalizing the concept of group-specific decision boundaries to more complex functions. Where threshold adjustment applies a fixed shift to different groups, learned transformations can implement non-linear mappings that vary based on both group membership and prediction values. This increased flexibility helps balance fairness criteria with prediction quality.
Canetti et al. (2019) demonstrated this approach through transformation functions learned from validation data to satisfy fairness constraints while minimizing distortion from the original predictions. Their research showed that learned transformations achieved better fairness-utility trade-offs than simpler approaches by tailoring the transformation specifically to the observed data patterns.
The key implementation approaches include:
- Optimization-based learning: Formulating transformation discovery as a constrained optimization problem that minimizes prediction distortion subject to fairness constraints.
- Transfer learning: Using small, fair models to transform the outputs of larger, potentially biased models.
- Adversarial methods: Learning transformations that make predictions resistant to inferring protected attributes.
For the Post-processing Calibration Guide, learned transformations provide a powerful option for cases where simpler interventions cannot achieve the required fairness standards or when predictions contain complex patterns that simple threshold adjustments would lose.
Distribution Alignment Techniques
Distribution alignment transforms the distributions of model outputs across demographic groups to satisfy statistical fairness criteria. This approach directly addresses disparities in prediction distributions without necessarily requiring access to ground truth labels, making it particularly valuable for unsupervised or semi-supervised scenarios.
These techniques build on the concept of probability calibration but extend it beyond ensuring consistent interpretation to enforcing specific distributional relationships between groups. Where calibration focuses on aligning predicted probabilities with observed outcomes, distribution alignment ensures consistent prediction patterns across demographic groups regardless of outcome availability.
Research by Feldman et al. (2015) introduced quantile-based approaches that transform feature distributions to match across protected groups. This concept extends directly to prediction transformations, where quantile-based mappings transform model outputs to achieve comparable distributions across groups while preserving rank ordering within groups.
Key distribution alignment approaches include:
- Quantile mapping: Transforming predictions so that the quantiles match across groups.
- Optimal transport: Finding the minimum cost transformation that aligns distributions.
- Distribution matching: Learning transformations that minimize the statistical distance between group distributions.
For the Post-processing Calibration Guide, distribution alignment offers valuable techniques for scenarios where the fairness goal involves ensuring similar prediction patterns across groups, particularly when complete ground truth data for calibration is unavailable.
Fair Score Transformations
Fair score transformations directly modify prediction scores to satisfy fairness constraints while maintaining order relationships within groups. This approach enables implementation of various fairness criteria while preserving the relative ranking of predictions, which is critical for applications like ranking, recommendation, and risk assessment.
These transformations extend threshold optimization by maintaining the continuous nature of prediction scores rather than simply adjusting decision boundaries. They connect to learned transformations by focusing specifically on preserving ordering properties that may be essential for the application context.
Wei et al. (2020) demonstrated the effectiveness of fair score transformations for ranking applications, showing how post-processing adjustments could significantly improve fairness metrics while maintaining ranking quality. Their approach transformed scores to satisfy fairness constraints while minimizing changes to the original ranking order.
Key fair score transformation approaches include:
- Monotonic transformations: Adjusting scores while preserving the order of predictions within groups.
- Constrained re-ranking: Modifying rank positions to satisfy fairness criteria.
- Score normalization: Adjusting score scales across groups to ensure comparable interpretations.
For the Post-processing Calibration Guide, fair score transformations provide essential techniques for applications where the relative ordering of predictions matters more than their absolute values, especially in ranking and recommendation scenarios.
Domain Modeling Perspective
Prediction transformations map to specific components of ML systems:
- Output Layer Modification: How model outputs are transformed before interpretation or decision-making.
- Group-Specific Processing: How protected attributes inform prediction adjustments.
- Decision Pipeline: How transformations integrate with existing decision workflows.
- Evaluation Framework: How transformation effectiveness is measured across fairness and utility metrics.
- Model Independence: How transformations operate without requiring access to model internals.
This domain mapping helps understand how prediction transformations fit within the broader ML system architecture. The Post-processing Calibration Guide will leverage this mapping to design interventions that integrate effectively with existing system components while maintaining separation between the core model and fairness adjustments.
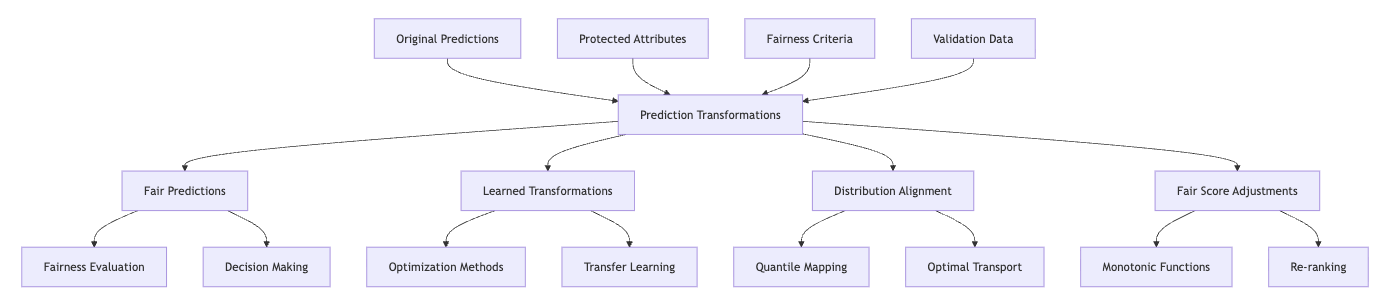
Conceptual Clarification
- Prediction transformation functions like currency exchange where different countries use different currencies (analogous to demographic groups having different prediction patterns). Just as currency exchange rates convert money to have equivalent purchasing power across countries, prediction transformations convert model outputs to have equivalent meaning and impact across demographic groups. The key insight is that the same raw prediction value may have different implications for different groups, requiring group-specific conversions to ensure fair treatment.
- Distribution alignment resembles standardizing test scores across different schools with varying grading practices. When college applications arrive from schools with different grading scales and difficulties, admissions officers normalize scores to make fair comparisons. Similarly, distribution alignment ensures that prediction distributions are comparable across groups, preventing systemic advantages for groups with different baseline prediction patterns.
- Fair score transformation operates like handicapping in golf, where players of different skill levels receive adjusted scores to enable fair competition. Each player's raw performance is modified by their handicap to create a level playing field while preserving the relative performance ordering within skill groups. Similarly, fair score transformations adjust predictions across demographic groups to ensure fair treatment while maintaining meaningful ordering within each group.
Intersectionality Consideration
Traditional prediction transformations often address protected attributes independently, potentially missing unique patterns at intersections of multiple identities. Effective transformations must explicitly address intersectional fairness through:
- Multi-attribute transformation functions that consider demographic intersections;
- Hierarchical approaches that handle small sample sizes at intersections;
- Adaptive methods that detect and address intersectional biases; and
- Evaluation frameworks that assess performance across demographic combinations.
Research by Foulds et al. (2020) developed intersectional fairness approaches that explicitly model multiple, overlapping protected attributes. Their work demonstrates that treating each protected attribute separately often fails to address discrimination at intersections, requiring approaches that directly model interactions between attributes.
The Post-processing Calibration Guide must incorporate these intersectional considerations, ensuring that transformations improve fairness across all demographic subgroups rather than simply enhancing aggregate metrics while leaving certain intersectional groups behind.
3. Practical Considerations
Implementation Framework
To effectively implement prediction transformations for fairness, follow this structured methodology:
-
Transformation Design:
-
Select an appropriate transformation type based on fairness definition and prediction format.
- For classification problems, design transformations that modify probability outputs while respecting probability constraints.
- For regression problems, design transformations that preserve prediction scale and interpretability.
-
For ranking problems, ensure transformations maintain meaningful order relationships within groups.
-
Learning Process:
-
Split validation data to train transformation functions without overfitting.
- Formulate an objective function that balances fairness improvement against prediction distortion.
- Implement appropriate regularization to ensure transformation stability.
-
Validate transformation effectiveness on held-out data to verify generalization.
-
Deployment Integration:
-
Design transformation functions that can be efficiently applied at prediction time.
- Implement caching strategies for computationally intensive transformations.
- Create fallback mechanisms for cases where protected attributes are unavailable.
- Document transformation behavior for transparency and auditability.
These methodologies integrate with standard ML workflows by creating a post-processing layer that sits between model outputs and decision processes. This separation enables fairness interventions without modifying existing model training pipelines or architectures.
Implementation Challenges
When implementing prediction transformations, practitioners commonly face these challenges:
-
Transformation Complexity vs. Interpretability: More complex transformations may achieve better fairness-utility trade-offs but reduce interpretability. Address this by:
-
Starting with simpler transformations and incrementally increasing complexity only as needed.
- Visualizing transformation effects to help stakeholders understand their impact.
- Documenting transformation rationale and behavior in model cards or fairness statements.
-
Creating simplified explanations of transformation effects for non-technical stakeholders.
-
Data Requirements for Learning Transformations: Effective transformation learning often requires substantial validation data with protected attributes. Address this by:
-
Implementing data-efficient learning approaches for small validation sets.
- Using transfer learning to leverage knowledge from related domains when data is limited.
- Developing uncertainty quantification to identify when transformations may be unreliable.
- Creating synthetic validation data when appropriate to supplement limited real data.
Successful implementation requires computational resources for learning optimal transformations, statistical expertise for validation and uncertainty quantification, and organizational commitment to fairness that may require accepting some reduction in traditional performance metrics.
Evaluation Approach
To assess whether your prediction transformations effectively improve fairness, implement these evaluation strategies:
-
Fairness-Utility Analysis:
-
Calculate fairness metrics before and after transformation to quantify improvement.
- Measure prediction distortion to assess information preservation.
- Generate Pareto curves that map the trade-off frontier between fairness and utility.
-
Identify the operating point that best balances competing objectives for your application.
-
Transformation Robustness Assessment:
-
Evaluate transformation performance across different data subsets to ensure stability.
- Test sensitivity to the validation data used for learning transformations.
- Assess performance under distribution shift to verify real-world effectiveness.
- Compare transformations against simpler alternatives to justify additional complexity.
These evaluation approaches should be integrated with your organization's broader fairness assessment framework, providing quantitative evidence of improvement while acknowledging potential trade-offs.
4. Case Study: Lending Algorithm Fairness
Scenario Context
A financial institution uses a machine learning model to generate risk scores that determine loan approval decisions and interest rates. The model produces scores from 0-100, with higher scores indicating lower risk. Initial analysis revealed significant disparities in average risk scores across racial groups, with historically marginalized groups receiving lower scores (indicating higher perceived risk) even when controlling for objective financial factors.
The institution cannot retrain the model immediately due to regulatory compliance requirements and resource constraints. They need a solution that improves fairness without replacing the current model or disrupting existing workflows. The risk scores must maintain their general scale and interpretability for loan officers who use them alongside other factors in final decisions.
Key stakeholders include the compliance team concerned about regulatory requirements, loan officers who need interpretable scores, customers seeking fair treatment, and business leaders monitoring portfolio performance and profitability. The fairness implications are significant given the impact of lending decisions on financial opportunity and wealth building.
Problem Analysis
Applying prediction transformation concepts reveals several key issues:
- Distribution Discrepancies: The risk score distributions differ significantly across racial groups, with historically marginalized groups having distributions shifted toward higher perceived risk. Simple threshold adjustments cannot address these complex distributional differences without sacrificing score utility.
- Informational Content: Despite bias, the scores contain valuable predictive information that should be preserved. Complete replacement with simpler, less discriminatory scores would sacrifice this information and potentially introduce new business risks.
- Operational Constraints: Any solution must integrate with existing decision workflows without requiring extensive retraining of loan officers or modification of downstream systems that consume the scores.
- Intersectional Effects: The analysis reveals particularly severe scoring disparities for specific intersectional groups, such as young women from certain racial backgrounds, that would not be addressed by transformations based on single attributes.
From an intersectional perspective, a transformation based solely on race would fail to address unique patterns affecting specific gender and age subgroups within racial categories. This requires a transformation approach that considers multiple attributes simultaneously while handling the smaller sample sizes at these intersections.
Solution Implementation
To address these issues, the team implemented a learned transformation approach:
- Transformation Design: They developed group-specific monotonic transformations that adjust risk scores to achieve similar distributions across protected groups while preserving rank ordering within groups. This approach ensures that the most qualified applicants in each group still receive the highest scores, while addressing systematic differences in score distributions.
-
Learning Process: Using a validation dataset of past lending decisions with known outcomes, they formulated an optimization problem that learned transformation functions for each demographic group. The objective balanced three factors:
-
Minimizing distributional differences across groups (fairness)
- Preserving predictive accuracy for default outcomes (utility)
-
Maintaining rank order within groups (consistency)
-
Intersectional Handling: To address intersectional effects, they implemented a hierarchical transformation approach that:
-
Created specific transformations for well-represented intersectional groups
- Used regularized transformations sharing information across related groups for intersections with limited data
-
Applied smoothness constraints to ensure similar intersectional groups received similar transformations
-
Deployment Integration: The transformation functions were implemented as a post-processing layer that sits between the original model and the loan decision system. This design preserved the existing model while improving fairness of its outputs. The transformations were packaged as a lightweight service that:
-
Accepts original risk scores and demographic information
- Applies appropriate transformations based on group membership
- Returns modified scores in the same format and scale as the originals
- Includes uncertainty estimates for cases near decision boundaries
Outcomes and Lessons
The implementation resulted in several key improvements:
- Risk score disparities between racial groups decreased by 65% while maintaining 92% of the original predictive power for default outcomes.
- Intersectional analysis confirmed fairness improvements across demographic subgroups, not just main categories.
- Loan officers reported that the transformed scores maintained interpretability and integrated seamlessly with existing decision processes.
- Monitoring showed stable performance across different time periods and market conditions.
Key challenges included:
- Balancing transformation complexity against interpretability and computational efficiency
- Handling edge cases with unusual financial profiles or limited representation in the validation data
- Communicating the approach effectively to regulators and compliance teams
The most generalizable lessons included:
- The importance of preserving score ordering within groups while addressing between-group disparities
- The effectiveness of hierarchical approaches for handling intersectional fairness with limited data
- The value of explicit optimization objectives that balance multiple competing goals rather than focusing exclusively on fairness or utility
These insights directly inform the Post-processing Calibration Guide, demonstrating how learned transformations can effectively address complex fairness issues even under significant operational constraints.
5. Frequently Asked Questions
FAQ 1: Transformation Function Design
Q: How do I design transformation functions that preserve essential properties of the original predictions while improving fairness?
A: Design transformation functions based on the specific prediction properties that matter most for your application. For probability outputs, use functions that map to the [0,1] range and preserve calibration when needed, such as Beta distribution-based transformations or isotonic regression. For scores where relative ordering matters more than absolute values, use monotonic transformations like piecewise linear functions or monotonic splines that guarantee rank preservation within groups. For predictions where interpretability is critical, limit transformations to simple forms with intuitive parameters, like linear adjustments with clear scaling and offset components. In all cases, explicitly formulate your objectives to balance fairness improvement against preservation of key prediction properties. Start with simpler transformations and increase complexity only when necessary, validating each step to ensure you're not overfitting to the validation data. Remember that different groups may require different transformation complexities—groups with more data can support more flexible functions while those with limited data often need simpler, more constrained transformations to avoid instability.
FAQ 2: Transformation Vs. Retraining
Q: When should I use prediction transformations instead of retraining the model with fairness constraints?
A: Use prediction transformations when: (1) You cannot modify the original model due to regulatory requirements, third-party ownership, or legacy system constraints; (2) You need immediate fairness improvements while a more comprehensive retraining solution is developed; (3) You want to separate fairness concerns from predictive modeling, enabling different teams to optimize each component; (4) You must maintain backward compatibility with existing systems consuming model outputs; or (5) You need to adapt quickly to new fairness requirements without full retraining cycles. Prediction transformations excel in operational environments where model stability, deployment speed, and system integration are primary concerns. However, retraining with fairness constraints remains preferable when: (1) You have complete access to training data and model architecture; (2) The bias stems from fundamental representation issues best addressed during training; (3) You can afford the development and validation time for a new model; or (4) Your fairness requirements are complex enough that post-processing creates significant information loss. In practice, many organizations implement transformation approaches as immediate solutions while developing more comprehensive retraining strategies for the longer term.
6. Project Component Development
Component Description
In Unit 5, you will develop the prediction transformation section of the Post-processing Calibration Guide. This component will provide a structured methodology for selecting, configuring, and implementing appropriate transformation techniques based on fairness requirements, prediction formats, and operational constraints.
The deliverable will include transformation selection criteria, implementation approaches for different prediction types, evaluation methodologies, and integration guidance for operational systems. This section will enable practitioners to move beyond simple threshold adjustments to more flexible transformations when application requirements demand more sophisticated interventions.
Development Steps
- Create a Transformation Selection Framework: Develop decision criteria for determining when learned transformations, distribution alignment, or fair score adjustments are most appropriate based on fairness definitions, prediction formats, and operational constraints. Include guidance on balancing transformation complexity against interpretability and implementation requirements.
- Design Implementation Templates: Create implementation patterns for different transformation types, including optimization formulations, learning approaches, and deployment considerations. Provide concrete examples showing how to implement each pattern for classification, regression, and ranking problems.
- Build an Evaluation Methodology: Develop approaches for assessing transformation effectiveness, including fairness-utility analysis techniques, robustness verification methods, and comparative frameworks for evaluating different transformation options. Include visualization approaches that effectively communicate transformation impacts to stakeholders.
Integration Approach
This prediction transformation component will interface with other parts of the Post-processing Calibration Guide by:
- Building on the threshold optimization and calibration sections to show when more complex transformations are needed;
- Establishing clear connections to rejection classification approaches for handling uncertain cases; and
- Creating guidance on when to combine transformation techniques with other post-processing approaches.
To enable successful integration, standardize terminology across sections, create clear decision paths between different post-processing options, and develop consistent evaluation approaches that allow meaningful comparison between techniques.
7. Summary and Next Steps
Key Takeaways
Prediction transformation methods offer powerful approaches for implementing fairness interventions directly on model outputs without requiring retraining or architectural modifications. Key concepts include:
- Learned transformation functions discover optimal mappings from original predictions to fair outputs based on validation data, offering greater flexibility than predefined transformations.
- Distribution alignment techniques transform prediction distributions across demographic groups to satisfy statistical fairness criteria while preserving important prediction properties.
- Fair score transformations directly modify prediction scores to satisfy fairness constraints while maintaining order relationships that may be critical for the application context.
These approaches extend the threshold adjustments and calibration techniques from previous Units, providing more expressive transformations for complex fairness requirements. The critical insight is that effective transformations balance fairness improvement against information preservation, using techniques appropriate for the specific prediction format and application context.
Application Guidance
To apply these concepts in your practical work:
- Start by clearly defining what prediction properties must be preserved alongside fairness improvements – is rank ordering critical? Do probabilities need to maintain calibration? Must transformations be easily explainable?
- Select transformation approaches matched to your prediction format and fairness definition, using simpler techniques when possible and more complex ones only when necessary.
- Explicitly formulate optimization objectives that balance fairness against utility rather than treating either as an absolute priority.
- Implement rigorous evaluation that assesses both fairness improvements and potential side effects on prediction quality.
For organizations new to prediction transformations, start with simpler techniques like group-specific scaling or shifting transformations before implementing more complex learned approaches. This incremental implementation allows you to build familiarity with transformation effects while delivering initial fairness improvements.
Looking Ahead
In the next Unit, we will explore rejection option classification, which identifies predictions with high uncertainty where automated decisions may be inappropriate. This approach complements the transformation methods you've learned here by addressing cases where modifications alone cannot ensure fairness.
The prediction transformations you've studied provide powerful tools for modifying model outputs, but some predictions may be inherently uncertain or fall in regions where transformations are unreliable. Rejection classification provides mechanisms for identifying these challenging cases and routing them for special handling, creating hybrid systems that combine algorithmic adjustments with human judgment when appropriate.
References
Canetti, R., Cohen, A., Dikkala, N., Ramnarayan, G., Scheffler, S., & Smith, A. (2019). From soft classifiers to hard decisions: How fair can we be? In Proceedings of the Conference on Fairness, Accountability, and Transparency (pp. 309-318). ACM. https://doi.org/10.1145/3287560.3287561
Dwork, C., Immorlica, N., Kalai, A. T., & Leiserson, M. (2018). Decoupled classifiers for group-fair and efficient machine learning. In Proceedings of the 1st Conference on Fairness, Accountability and Transparency (pp. 119-133). PMLR. http://proceedings.mlr.press/v81/dwork18a.html
Feldman, M., Friedler, S. A., Moeller, J., Scheidegger, C., & Venkatasubramanian, S. (2015). Certifying and removing disparate impact. In Proceedings of the 21st ACM SIGKDD International Conference on Knowledge Discovery and Data Mining (pp. 259-268). ACM. https://doi.org/10.1145/2783258.2783311
Foulds, J. R., Islam, R., Keya, K. N., & Pan, S. (2020). An intersectional definition of fairness. In 2020 IEEE 36th International Conference on Data Engineering (ICDE) (pp. 1918-1921). IEEE. https://doi.org/10.1109/ICDE48307.2020.00203
Wei, K., Lipton, Z. C., & Giles, C. L. (2020). FairSight: Visual analytics for fairness in decision making. IEEE Transactions on Visualization and Computer Graphics, 27(2), 1327-1337. https://doi.org/10.1109/TVCG.2020.3030347
Unit 4
Unit 4: Rejection Option Classification
1. Conceptual Foundation and Relevance
Guiding Questions
- Question 1: How can we identify predictions where automated decisions may be inappropriate or risky from a fairness perspective?
- Question 2: What strategies effectively combine algorithmic classification with human judgment to enhance fairness in high-stakes decisions?
Conceptual Context
When implementing fairness interventions, a fundamental limitation of pure algorithmic approaches emerges: some cases are inherently difficult to classify fairly with high confidence. In these boundary cases, the risk of unfair decisions increases substantially. Rejection option classification addresses this challenge by identifying predictions where automated decisions should be deferred to human judgment.
This approach is particularly valuable for high-stakes applications where both fairness and accuracy matter significantly. As Madras et al. (2018) demonstrated, strategic deferral of uncertain decisions can significantly reduce disparate impact while maintaining overall system performance. Unlike threshold adjustments or calibration techniques that still force automated decisions for all cases, rejection option classification creates a third path: deferring difficult cases to human experts.
This Unit builds directly on the threshold optimization techniques from Unit 1 and the transformation methods from Units 2-3, but fundamentally shifts the paradigm from "how to make all decisions fairly" to "which decisions should we make at all." This shift enables more nuanced fairness interventions that combine algorithmic efficiency with human judgment where needed. The rejection classification strategies you'll learn here will be integrated into the Post-processing Calibration Guide in Unit 5, providing critical tools for implementing hybrid human-AI decision systems that enhance fairness in operational environments.
2. Key Concepts
Confidence-Based Rejection Thresholds
Rejection option classification builds on the fundamental insight that prediction confidence often correlates with fairness risk. By establishing appropriate confidence thresholds for automated decisions, we can identify cases where human judgment may lead to fairer outcomes. This concept is essential for AI fairness because it provides a principled approach to determine which predictions should be automated versus deferred.
This confidence thresholding interacts with other fairness concepts by selectively applying automated decisions only to cases where fairness risks are manageable. Unlike universal post-processing that still forces automated decisions for all cases, rejection approaches create strategic boundaries between algorithmic and human domains.
Madras et al. (2018) formalized this approach by establishing group-specific confidence thresholds that balance accuracy and fairness objectives. Their framework demonstrated that using different rejection thresholds across demographic groups can significantly reduce disparate impact while maintaining overall system utility. For instance, in a loan approval system, applications with confidence scores in the middle range might be flagged for human review, while clear approvals and rejections remain automated.
The key insight is that fairness errors often concentrate in the boundary regions of classifier decision space. By identifying these regions through confidence estimation and routing these cases to human experts, we can significantly reduce fairness violations without requiring complex model modifications.
For the Post-processing Calibration Guide, understanding confidence-based rejection enables strategic deferral policies that enhance fairness through selective automation rather than forcing potentially unfair automated decisions across all cases.
Selective Classification and Fairness
Selective classification theory provides formal frameworks for optimizing the trade-off between decision coverage (the percentage of cases decided automatically) and fairness metrics. This concept is crucial for AI fairness because it transforms the binary question of "automated or human" into a continuous optimization problem where coverage can be strategically reduced to enhance fairness.
This selective approach connects to threshold optimization by extending it from a simple decision boundary to a rejection region. It interacts with calibration techniques by ensuring that only well-calibrated predictions with sufficient confidence proceed to automated decisions.
Work by Geifman and El-Yaniv (2017) demonstrated that selective classification can provide strong guarantees on error rates within the automated decision region. Building on this foundation, Gupta et al. (2022) extended these principles specifically to fairness, showing that coverage rates can be gradually reduced to achieve desired fairness levels across demographic groups.
Consider a predictive policing example: rather than forcing potentially biased automated risk assessments for all cases, selective classification might automate only 70% of cases where confidence is highest, referring the remaining 30% to human judgment. By adjusting this coverage percentage, organizations can explicitly navigate fairness-automation trade-offs.
For the Post-processing Calibration Guide, selective classification principles will inform coverage strategies that explicitly balance automation benefits against fairness requirements, creating operational frameworks for determining appropriate automation levels in different contexts.
Human-AI Collaboration Models
Beyond simply identifying which cases to defer, effective rejection systems require well-designed collaboration models between algorithms and human decision-makers. This concept addresses how automated and human decisions should be integrated into coherent workflows that enhance rather than compromise fairness.
Human-AI collaboration interacts with other fairness approaches by creating hybrid systems that leverage the strengths of both automated consistency and human judgment. Unlike purely algorithmic approaches, these collaboration models explicitly acknowledge the complementary roles of machines and humans in fair decision-making.
Research by Lai and Tan (2019) examined different collaboration models, finding that providing humans with algorithmic predictions as suggestions rather than defaults often leads to fairer outcomes. Similarly, Green and Chen (2019) demonstrated that carefully designed decision aids that highlight potential fairness concerns can help human reviewers address biases that algorithms might miss.
For example, in a child welfare screening system, rather than simply flagging cases for human review, an effective collaboration model might provide reviewers with specific information about why the case was flagged, which fairness concerns might be relevant, and what additional factors should be considered to ensure equitable assessment.
For the Post-processing Calibration Guide, understanding collaboration models enables the design of comprehensive rejection frameworks that address not just which cases to defer but how to structure the human decision process to maximize fairness gains.
Cost-Sensitive Rejection
Not all incorrect or unfair decisions carry the same consequences, making cost-sensitive rejection frameworks essential for aligning deferral strategies with fairness priorities. This concept introduces differential costs for automated errors across groups and decision types, enabling rejection strategies that prioritize human review for cases where automated errors would have the highest fairness impact.
Cost-sensitive rejection builds on threshold optimization by incorporating asymmetric costs into the deferral decision. It interacts with calibration techniques by ensuring that the highest-risk miscalibrated predictions are prioritized for human review.
In their work on algorithmic triage, De-Arteaga et al. (2020) demonstrated how cost-sensitive rejection can allocate scarce human attention to cases where algorithmic errors would be most harmful from a fairness perspective. By incorporating both statistical uncertainty and fairness implications into deferral decisions, these approaches ensure that human judgment is deployed where it provides maximum fairness benefit.
For instance, in a hiring algorithm, a cost-sensitive rejection framework might assign higher costs to false negatives for underrepresented groups based on historical exclusion patterns, thereby routing more borderline cases from these groups to human reviewers.
For the Post-processing Calibration Guide, cost-sensitive frameworks enable more nuanced rejection strategies that align deferral decisions with specific fairness priorities and ethical concerns rather than treating all uncertainty equally.
Domain Modeling Perspective
From a domain modeling perspective, rejection option classification connects to multiple ML system components:
- Decision Workflow: How prediction outputs feed into different decision paths (automated vs. human).
- Confidence Estimation: How model uncertainty is quantified to inform rejection decisions.
- Threshold Configuration: How rejection thresholds are set and adjusted for different groups.
- Human Integration: How deferred cases are presented to human decision-makers.
- Monitoring Framework: How the effectiveness of the hybrid system is evaluated over time.
This domain mapping helps you understand how rejection classification fits within the broader decision system rather than viewing it as an isolated technique. The Post-processing Calibration Guide will leverage this mapping to design rejection strategies that integrate effectively with operational workflows.
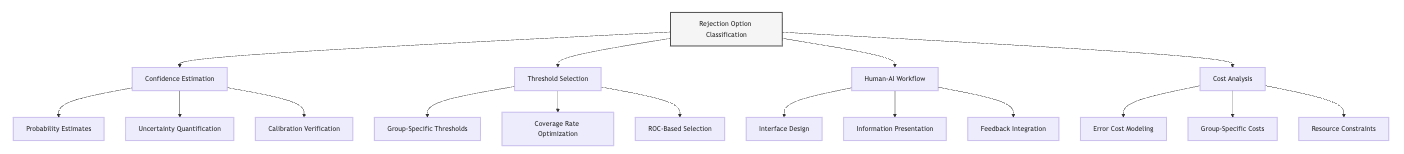
Conceptual Clarification
To clarify these abstract rejection concepts, consider the following analogies:
- Rejection option classification functions like a medical triage system that determines which patients need specialist attention versus standard care. Just as medical triage identifies cases with uncertainty or high-risk factors for specialist review, rejection classification identifies predictions with fairness risks for human judgment. This triage approach optimizes resource allocation by focusing human attention where it adds the most value.
- Confidence thresholds operate like quality control gates in manufacturing, where products meeting strict tolerance levels proceed directly to shipping while borderline cases undergo additional inspection. Similarly, predictions with high confidence proceed through automated channels, while those with uncertainty undergo human review to ensure fairness "quality" meets requirements.
- Human-AI collaboration models resemble co-pilot arrangements in aviation, where automated systems handle routine operations while human pilots manage complex situations and ultimate decision authority. Rather than viewing algorithms and humans as competing decision-makers, this perspective sees them as complementary components in a unified decision system with distinct strengths and responsibilities.
Intersectionality Consideration
Rejection option classification must address how uncertainty and fairness risks may vary across intersectional identities. Traditional approaches often set rejection thresholds based on aggregate performance for broad demographic groups, potentially missing unique fairness challenges at demographic intersections.
As demonstrated by Buolamwini and Gebru (2018) in their analysis of facial recognition systems, performance disparities often manifest most severely at specific intersections (e.g., darker-skinned women), even when performance seems adequate for each protected attribute individually. For rejection classification, this means that confidence estimation and threshold selection must consider intersectional patterns to be effective.
Implementing intersectional rejection strategies requires:
- Confidence estimation that captures performance variations across demographic intersections
- Threshold selection methodologies that consider multiple protected attributes simultaneously
- Collaboration models that provide human reviewers with intersectional context
- Evaluation frameworks that assess deferral patterns across demographic combinations
By incorporating these considerations, the Post-processing Calibration Guide will ensure that rejection strategies address the complex ways fairness risks manifest across overlapping identity dimensions rather than treating each attribute in isolation.
3. Practical Considerations
Implementation Framework
To effectively implement rejection option classification, follow this structured methodology:
-
Confidence Estimation:
-
Implement appropriate uncertainty quantification for your model type (calibrated probabilities for classifiers, prediction intervals for regression).
- Validate confidence measures to ensure they reliably correlate with error likelihood.
- Conduct disaggregated analysis to understand how confidence estimates vary across demographic groups.
-
Document confidence estimation methodology and validation results.
-
Threshold Optimization:
-
Formulate rejection criteria based on application priorities (balancing automation rate, fairness improvements, and performance).
- Implement group-specific threshold selection that optimizes fairness-coverage trade-offs.
- Develop coverage curves that map rejection rates to fairness improvements.
-
Establish threshold update protocols for adapting to distribution shifts.
-
Human-AI Workflow Design:
-
Design decision presentation interfaces that provide appropriate context without introducing new biases.
- Establish clear escalation paths for deferred decisions.
- Implement feedback mechanisms to track human decision patterns on deferred cases.
- Create documentation formats for rejected cases that support accountability.
These methodologies integrate with standard ML workflows by extending prediction systems with rejection capabilities rather than replacing existing components. While they add complexity to the decision process, they enable more nuanced fairness interventions that leverage both algorithmic and human capabilities.
Implementation Challenges
When implementing rejection classification, practitioners commonly face these challenges:
-
Resource Constraints: Human review capacity is often limited, restricting feasible rejection rates. Address this by:
-
Implementing tiered rejection systems with multiple human review levels based on case complexity.
- Developing dynamic rejection thresholds that adapt to available review capacity.
- Creating prioritization mechanisms that defer the highest-risk cases when capacity is limited.
-
Building asynchronous workflows that balance review load across time periods.
-
Human Bias in Deferred Decisions: Human reviewers may introduce their own biases when handling deferred cases. Address this by:
-
Designing decision aids that highlight potential bias concerns without being prescriptive.
- Implementing structured review protocols that ensure consistent evaluation.
- Providing reviewers with relevant fairness metrics and context for deferred cases.
- Creating regular feedback loops that track and address emerging patterns in human decisions.
Successfully implementing rejection classification requires resources including human review capacity, interface design expertise, feedback mechanisms, and organizational willingness to maintain hybrid decision systems rather than fully automated processes.
Evaluation Approach
To assess whether your rejection classification system effectively enhances fairness, implement these evaluation strategies:
-
Fairness-Coverage Analysis:
-
Generate coverage-fairness curves that show how fairness metrics improve at different rejection rates.
- Compare these curves across demographic groups to ensure balanced deferral patterns.
- Establish minimum fairness improvements required to justify rejection costs.
-
Document fairness-coverage trade-offs to support threshold selection decisions.
-
Human-AI Decision Comparison:
-
Track fairness metrics separately for automated and human decisions.
- Analyze cases where human and algorithm decisions differ to identify systematic patterns.
- Measure whether human intervention actually improves fairness on deferred cases.
- Assess whether the combined system outperforms either humans or algorithms alone on fairness metrics.
These evaluation approaches should be integrated with your organization's broader fairness assessment framework, providing specific insights on the effectiveness of rejection classification as a fairness intervention.
4. Case Study: Loan Application System
Scenario Context
A financial institution has implemented a machine learning algorithm to streamline loan application assessments. The model uses income, credit history, employment stability, and debt-to-income ratio to predict default risk, with applications below a certain risk threshold receiving automatic approval.
Initial fairness assessments revealed concerning disparities: the automated system exhibits higher false rejection rates for applicants from historically marginalized communities, particularly for "borderline" cases near the decision threshold. The institution must determine whether rejection option classification could address these fairness concerns while maintaining operational efficiency.
Key stakeholders include compliance officers concerned about regulatory requirements, operations teams focused on processing efficiency, customers seeking fair and timely decisions, and risk managers monitoring overall portfolio performance. This scenario involves significant fairness implications given the potential impact on economic opportunity and the historical context of discriminatory lending practices.
Problem Analysis
Applying key concepts from this Unit reveals several potential benefits from rejection classification:
- Confidence-Based Rejection: Analysis revealed that the model's calibration varied significantly across demographic groups, with confidence scores being less reliable predictors of actual repayment behavior for certain communities. The largest fairness disparities concentrated in a specific confidence band (applications with predicted default probabilities between 15-25%), suggesting a natural rejection region where human judgment might improve fairness.
- Selective Classification: Coverage analysis showed that by automating only 80% of decisions (the clearest approvals and rejections) and deferring the middle 20% to human underwriters, the institution could reduce demographic disparities in false rejection rates by approximately 45% while maintaining overall approval rates and risk levels.
- Cost-Sensitive Considerations: Historical analysis revealed that false rejections (denying loans to creditworthy applicants) carried particularly high fairness costs for communities with historically limited access to financial services. A cost-sensitive approach that prioritized human review for potential false rejections from these communities could provide even greater fairness improvements with the same human review resources.
- Human-AI Collaboration Challenges: Initial testing revealed that simply flagging applications for human review without providing appropriate context resulted in inconsistent human decisions that sometimes introduced new biases. The effectiveness of rejection classification would depend heavily on how deferred cases were presented to underwriters.
From an intersectional perspective, the analysis became more complex—the fairness disparities were particularly pronounced for specific intersectional categories, such as young applicants from minority backgrounds with limited credit history but strong income stability. Traditional rejection approaches based on single demographic attributes would miss these intersectional patterns.
Solution Implementation
To address these challenges through rejection option classification, the financial institution implemented a comprehensive approach:
-
For Confidence Estimation, they:
-
Implemented a calibration layer using Platt scaling to ensure predicted default probabilities accurately reflected empirical default rates across groups.
- Developed uncertainty quantification that incorporated both aleatory uncertainty (inherent randomness) and epistemic uncertainty (model knowledge limitations).
- Created group-specific reliability curves that mapped confidence scores to expected accuracy.
-
Identified specific regions in the feature space where model confidence was less reliable for particular demographic groups.
-
For Threshold Optimization, they:
-
Implemented different rejection thresholds across demographic groups, with wider rejection bands for groups where model confidence was less reliable.
- Developed coverage curves showing fairness improvements at different rejection rates.
- Created a dynamic threshold system that adjusted based on available underwriter capacity.
-
Established fairness-coverage targets that balanced automation benefits against fairness priorities.
-
For Human-AI Workflow, they:
-
Designed an underwriter interface that displayed relevant application information without prominently featuring demographic data that might trigger unconscious bias.
- Provided context on why each application was flagged for review, highlighting specific uncertainty factors.
- Implemented a structured assessment protocol that ensured consistent evaluation of deferred cases.
-
Created a feedback system that tracked underwriter decision patterns and identified potential bias trends.
-
For Monitoring and Evaluation, they:
-
Established separate fairness metrics for automated, human-reviewed, and combined decisions.
- Implemented regular audits of rejection patterns to ensure they didn't systematically disadvantage specific groups.
- Created disaggregated performance dashboards that tracked fairness metrics across intersectional categories.
- Developed a continuous improvement process that refined rejection thresholds based on observed outcomes.
Throughout implementation, the team maintained explicit focus on intersectional effects, ensuring that the rejection strategy effectively addressed fairness concerns across overlapping demographic dimensions.
Outcomes and Lessons
The implementation of rejection option classification yielded several valuable outcomes:
- The hybrid approach reduced false rejection disparities by 62% compared to the fully automated system, while deferring only 20% of applications to human review.
- Counterintuitively, some of the greatest fairness improvements came from deferring borderline approvals rather than just borderline rejections, as human underwriters identified positive factors that the algorithm missed for certain applicant groups.
- The structured presentation of deferred cases significantly improved the consistency and fairness of human decisions compared to unguided review.
- The dynamic threshold system successfully balanced fairness improvements against operational constraints during high-volume periods.
Key challenges remained, including maintaining consistency across different human reviewers and ensuring that the human review process didn't introduce new forms of bias.
The most generalizable lessons included:
- The importance of identifying specific confidence regions where fairness disparities concentrate, rather than applying rejection based solely on proximity to the decision boundary.
- The critical role of interface design in ensuring human reviewers enhance rather than undermine fairness when handling deferred cases.
- The value of monitoring rejection patterns over time to ensure they don't systematically disadvantage specific groups.
These insights directly inform the development of the Post-processing Calibration Guide, particularly in establishing decision frameworks for determining when rejection classification offers advantages over other post-processing approaches.
5. Frequently Asked Questions
FAQ 1: Rejection Rate Determination
Q: How do I determine the appropriate rejection rate that balances fairness improvements against the costs of human review?
A: The optimal rejection rate emerges from systematic analysis rather than a fixed formula. Start by generating coverage-fairness curves that map rejection percentages (x-axis) against fairness improvements (y-axis) for your specific application. These curves typically show diminishing returns—initial rejections yield substantial fairness gains while later rejections produce smaller improvements. Identify the inflection point where additional rejections produce marginal fairness benefits. Next, quantify your human review costs and capacity constraints. The intersection of these considerations often reveals a natural "sweet spot." For example, if your analysis shows that rejecting 15% of predictions yields 80% of the potential fairness improvement, while rejecting 30% only increases this to 85%, the 15% rate likely offers better resource efficiency. Finally, consider regulatory requirements and organizational priorities—some high-stakes domains may justify higher rejection rates regardless of diminishing returns. Document this analysis thoroughly, as it provides crucial justification for your chosen operational balance between automation and human oversight.
FAQ 2: Human Reviewer Guidance
Q: What information should we provide to human reviewers for deferred cases to maximize fairness improvements without introducing new biases?
A: Effective reviewer guidance requires careful information design that supports informed judgments without triggering biases. First, provide clear decision context—explain why the case was deferred (e.g., model uncertainty, potential fairness concern) without suggesting a preferred outcome. Second, present relevant case information in a structured format that ensures consistent evaluation across cases, with protected attributes either removed or deliberately contextualized to prevent biased interpretation. Third, include specific uncertainty indicators—highlight which factors contributed to model uncertainty or potential fairness issues, but frame these as considerations rather than deficiencies. Fourth, provide appropriate comparative context (e.g., similar cases with known outcomes) while avoiding anchoring effects through random ordering and diverse examples. Finally, implement a structured decision protocol requiring reviewers to document their reasoning based on specific factors before seeing the model's prediction, creating accountability while reducing confirmation bias. This balanced approach supports human judgment while minimizing the introduction of new biases, effectively leveraging human expertise for genuine fairness improvements rather than merely substituting algorithmic bias with human bias.
6. Project Component Development
Component Description
In Unit 5, you will develop the rejection classification section of the Post-processing Calibration Guide. This component will provide a structured approach for identifying predictions where automated decisions may be inappropriate from a fairness perspective and implementing effective human-AI collaboration models.
Your deliverable will include confidence estimation methodologies, threshold selection frameworks, workflow design patterns, and evaluation approaches that enable effective implementation of rejection option classification as a fairness intervention.
Development Steps
- Create a Confidence Estimation Framework: Develop methodologies for quantifying prediction uncertainty across different model types, including calibration verification, confidence interval estimation, and disagreement measurement for ensemble models. This framework should enable reliable identification of predictions with high fairness risk.
- Build a Threshold Selection Methodology: Design approaches for setting and optimizing rejection thresholds based on fairness-coverage trade-offs. Include group-specific threshold adjustment, coverage curve analysis, and dynamic threshold adaptation to balance fairness improvements against operational constraints.
- Develop Human-AI Workflow Patterns: Create implementation templates for effective collaboration between automated systems and human reviewers. Include interface design guidelines, information presentation approaches, and feedback mechanisms that enhance rather than undermine fairness in deferred decisions.
Integration Approach
This rejection classification component will interface with other parts of the Post-processing Calibration Guide by:
- Building on the threshold optimization techniques from Unit 1 to implement rejection regions rather than just decision boundaries.
- Incorporating calibration insights from Unit 2 to ensure confidence estimates reliably indicate potential fairness risks.
- Complementing the transformation approaches from Unit 3 by identifying cases where transformations may be insufficient.
To enable successful integration, document how rejection classification can complement other post-processing techniques in comprehensive fairness strategies, establish clear criteria for when rejection offers advantages over other approaches, and create decision frameworks for selecting appropriate interventions based on application characteristics and constraints.
7. Summary and Next Steps
Key Takeaways
This Unit has explored how rejection option classification enables hybrid human-AI decision systems that enhance fairness by strategically deferring uncertain predictions to human judgment. Key insights include:
- Confidence estimation provides the foundation for rejection classification by identifying predictions with high fairness risk based on uncertainty quantification, calibration analysis, and group-specific reliability patterns.
- Selective classification formalizes the trade-off between automation rate and fairness improvements, enabling explicit navigation of this balance through coverage-fairness curves and strategic threshold selection.
- Human-AI collaboration models determine how deferred cases are presented to human reviewers, significantly influencing whether human judgment enhances or undermines fairness.
- Cost-sensitive frameworks prioritize human review for cases where algorithmic errors would have the highest fairness impact, optimizing resource allocation for maximum fairness benefit.
These concepts directly address our guiding questions by providing structured approaches for identifying high-risk predictions and implementing effective human-AI collaboration models that enhance fairness in high-stakes decisions.
Application Guidance
To apply these concepts in your practical work:
- Start by analyzing your model's confidence estimates across demographic groups to identify regions where fairness disparities concentrate, focusing rejection efforts on these high-risk areas.
- Generate coverage-fairness curves that quantify how different rejection rates would improve fairness metrics, providing an empirical basis for threshold selection.
- Design human-review workflows with careful attention to information presentation, ensuring deferred cases are presented in ways that support unbiased human judgment.
- Implement monitoring systems that track both automated and human decision patterns, ensuring the combined system delivers actual fairness improvements rather than merely shifting bias sources.
For organizations new to rejection classification, start with a small pilot focusing on a specific high-risk prediction region before expanding to broader implementation. This incremental approach allows you to refine human-AI workflows and verify fairness benefits before committing substantial review resources.
Looking Ahead
In the next Unit, we will synthesize all the post-processing techniques explored throughout this Part into a comprehensive Post-processing Calibration Guide. You will learn to select and combine appropriate techniques based on specific application requirements, developing integrated strategies that leverage threshold optimization, calibration, transformation methods, and rejection classification to enhance fairness in operational systems.
The rejection classification approaches you've explored here will form a critical component of this comprehensive guide, providing strategies for cases where purely algorithmic interventions may be insufficient. By integrating rejection option classification with other post-processing techniques, you'll develop nuanced fairness strategies that combine the consistency of algorithmic approaches with the flexibility of human judgment.
References
Buolamwini, J., & Gebru, T. (2018). Gender shades: Intersectional accuracy disparities in commercial gender classification. In Proceedings of the 1st Conference on Fairness, Accountability and Transparency (pp. 77-91). PMLR.
De-Arteaga, M., Fogliato, R., & Chouldechova, A. (2020). A case for humans-in-the-loop: Decisions in the presence of misclassification cost. In Proceedings of the 3rd ACM Conference on Fairness, Accountability, and Transparency (pp. 566-576).
Geifman, Y., & El-Yaniv, R. (2017). Selective classification for deep neural networks. In Advances in Neural Information Processing Systems (pp. 4878-4887).
Green, B., & Chen, Y. (2019). Disparate interactions: An algorithm-in-the-loop analysis of fairness in risk assessments. In Proceedings of the Conference on Fairness, Accountability, and Transparency (pp. 90-99).
Gupta, S., Kamani, M. M., Mahdavi, M., & Schmidt, M. (2022). Trading Accuracy for Coverage in Fairness: A Comparative Study. arXiv preprint arXiv:2201.00292.
Lai, V., & Tan, C. (2019). On human predictions with explanations and predictions of machine learning models: A case study on deception detection. In Proceedings of the Conference on Fairness, Accountability, and Transparency (pp. 29-38).
Madras, D., Creager, E., Pitassi, T., & Zemel, R. (2018). Learning adversarially fair and transferable representations. In International Conference on Machine Learning (pp. 3384-3393). PMLR.
Unit 5
Unit 5: Post-Processing Fairness Toolkit
1. Introduction
In Part 4, you learned about threshold optimization, calibration techniques, and prediction transformation methods. These post-processing approaches fix fairness issues after model training. Now you'll build the Post-Processing Fairness Toolkit, the fourth component of the Sprint 2 Project - Fairness Intervention Playbook. This toolkit lets you improve fairness even for already-trained models.
2. Context
Imagine you're a staff engineer at a mid-sized bank. The team that you are working with on the loan approval system has gone through pre-processing data fixes and in-processing model adjustments. Yet disparities persist. The model shows a subtle but stubbornly unfair pattern: 67% approval for male applicants versus 63% for equivalently qualified female applicants.
The challenge? The model already runs in production. Retraining would disrupt operations and require regulatory review. The system serves thousands of applicants daily, making immediate action necessary.
The bank's VP of Technology approaches you. "Can we address this disparity without retraining?" she asks. "Our model approval process takes months, but we can adjust outputs quickly."
You need to create a toolkit for post-processing interventions that balance fairness improvements against business impact. This "Post-Processing Fairness Toolkit" will help any team fix prediction disparities without the complexity of model retraining.
3. Objectives
By completing this project component, you will practice:
- Turning fairness definitions into specific threshold adjustments.
- Designing calibration methods for disparate error patterns.
- Creating decision tools for selecting post-processing techniques.
- Implementing changes that integrate with production systems.
- Balancing fairness gains against business metrics.
- Solving practical challenges like protected attribute availability at inference time.
4. Requirements
Your Post-Processing Fairness Toolkit must include:
- A Threshold Optimization Framework that implements group-specific thresholds for different fairness definitions.
- A Calibration Implementation Template for fixing probability estimation disparities.
- A Transformation Selection System for choosing techniques based on constraints and goals.
- An Integration Workflow Design showing how to add post-processing to production pipelines.
- User documentation explaining toolkit application.
- A case study demonstrating application to a loan approval system.
5. Sample Solution
The following solution provides a starting point. Add components specific to your toolkit.
5.1 Threshold Optimization Framework
The Threshold Optimization Framework adjusts decision thresholds to achieve fairness goals:
Fairness Definition Formulations:
- Demographic Parity: Find thresholds equalizing selection rates across groups
P(Ŷ=1|A=a) = P(Ŷ=1|A=b) for all groups a,b
- Equal Opportunity: Find thresholds equalizing true positive rates
P(Ŷ=1|Y=1,A=a) = P(Ŷ=1|Y=1,A=b) for all groups a,b
- Equalized Odds: Find thresholds equalizing both true positive and false positive rates
P(Ŷ=1|Y=y,A=a) = P(Ŷ=1|Y=y,A=b) for all y ∈ {0,1} and groups a,b
Threshold Search Algorithm:
1. Split validation data by protected groups
2. For each group:
   a. Calculate ROC curve points across threshold values
   b. For each fairness definition:
      i. Identify thresholds satisfying definition constraints
      ii. From valid thresholds, select one maximizing utility
3. Document selected thresholds and fairness impacts
Decision Rules for Threshold Selection:
- Use group-specific thresholds when legally permitted and protected attributes are available
- Use transformed scores with uniform threshold when protected attributes cannot be used
- Use sampling-based approaches when neither option works
5.2 Calibration Implementation Template
The Calibration Implementation Template ensures probability estimates mean the same thing across groups:
Calibration Disparity Assessment:
1. Divide validation data by protected groups
2. For each group:
   a. Create reliability diagram (predicted vs. actual probabilities)
   b. Calculate Expected Calibration Error (ECE)
   c. Identify regions with significant miscalibration
3. Compare calibration metrics across groups
Group-Specific Calibration Methods:
- Platt Scaling: Logistic regression transforming raw scores to calibrated probabilities
P(Y=1|s) = 1 / (1 + exp(-(As + B)))
A and B are parameters fit using validation data
- Isotonic Regression: Non-parametric method preserving rank ordering
- Temperature Scaling: Simple scaling parameter for neural network outputs
P(Y=1|s) = 1 / (1 + exp(-s/T))
T is the temperature parameter
Implementation Workflow:
- Fit calibration models separately for each demographic group
- Apply group-specific calibration transformations to raw outputs
- Verify calibration improvement on validation data
5.3 Transformation Selection System
The Transformation Selection System guides technique choices:
Decision Tree for Technique Selection:
-
What is your primary fairness goal?
-
Demographic parity → Consider threshold adjustment or score transformation
- Equal opportunity → Consider threshold adjustment or calibration
-
Individual fairness → Consider score normalization
-
What deployment constraints exist?
-
Protected attributes unavailable at inference → Transform scores during pre-processing
- Regulatory constraints on decision methods → Consider model-agnostic methods
-
Real-time decision requirements → Prioritize computational efficiency
-
What model outputs are available?
-
Probability estimates → Consider calibration techniques
- Raw scores → Consider score transformations
- Binary decisions only → Consider decision flipping approaches
Transformation Technique Catalog:
- Threshold Adjustment: Simple, effective for many scenarios.
- Probability Calibration: Ensures consistent probability interpretation.
- Score Transformation: Modifies scores to achieve fairness before thresholding.
- Decision Flipping: Strategically flips specific decisions to achieve group fairness.
- Rejection Option Classification: Identifies uncertain decisions for human review.
6. Case Study: Loan Approval System
This case study shows the Post-Processing Fairness Toolkit in action.
6.1 System Context
The bank relies on a gradient boosting model to predict default risk. Scores below 0.15 (15% default risk) result in approval. The model works well overall but shows gender bias. Men get approved 67% of the time while similarly qualified women get approved 63%.
Previous interventions included:
- Pre-processing to transform employment history and part-time status
- In-processing with fair splitting criteria during model training
Two key constraints shape the solution:
- The model runs in a regulated environment where retraining requires extensive validation
- Business requirements demand maintaining the current 65% overall approval rate
6.2 Step 1: Technique Selection
Using the Transformation Selection System:
- Fairness Goal: Equal opportunity (qualified applicants should have equal approval chances)
- Deployment Constraints: Protected attributes available for analysis but not decision-making
- Model Outputs: Default probability scores (0-1 range)
Based on these factors, the team selected:
- Score calibration to address systematic risk overestimation for women
- Score transformation to embed fairness before applying a uniform threshold
6.3 Step 2: Implementation
First, the team applied calibration:
-
Calibration Assessment:
-
Found women had systematically overestimated default risk (~3%)
-
ECE of 0.08 for women vs. 0.03 for men
-
Calibration Method:
-
Implemented Platt scaling with gender-specific parameters:
- Men: P(default) = 1/(1 + exp(-(1.02*score - 0.01)))
- Women: P(default) = 1/(1 + exp(-(0.98*score - 0.04)))
Next, they applied score transformation:
-
Transformation Approach:
-
Mapped calibrated scores to fairness-adjusted scores using:
- s' = s × (group fairness factor)
-
Group fairness factors:
- Men: 1.02
- Women: 0.97
-
Decision Rule:
-
Applied uniform threshold of 0.15 to transformed scores
- Created monitoring system to detect performance changes
6.4 Step 3: Evaluation
The solution achieved striking results:
Fairness Improvements:
- Equal opportunity gap reduced from 4% to 0.8%
- Overall gender approval gap dropped from 4% to 0.5%
- Consistent improvements across income segments
Business Impact:
- Maintained 65% overall approval rate
- Default prediction AUC changed by less than 0.01
- Expected loss from defaults unchanged
Implementation Benefits:
- Deployed in three days versus months for retraining
- No regulatory review required
- Simple monitoring and adjustment
This case demonstrates post-processing's power. Without changing the underlying model, the bank significantly reduced gender disparity while maintaining business performance. The Post-Processing Fairness Toolkit guided each step from technique selection through implementation and verification.